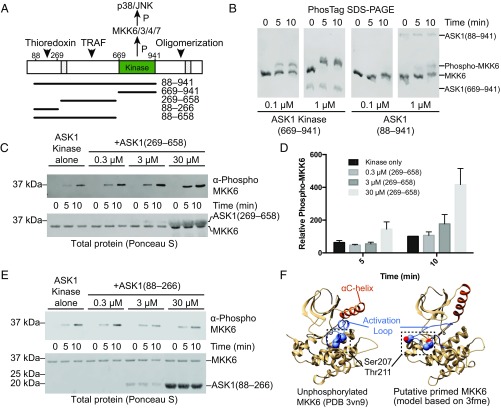
Fig. 1.
N-terminal regulatory domains of ASK1. (A) Schematic representation of ASK1 domains, with functional regions indicated, and previously proposed NCC and C-terminal coiled-coil regions hatched. Constructs used in this work are indicated below. Example purified proteins from each of these constructs are shown in Fig. S1A. (B) Phos-tag SDS/PAGE comparing phosphorylation of kinase dead MKK6 by ASK1 kinase domain (669–941), and ASK1(88–941) at matched concentrations. (C) MKK6 phosphorylation by 0.01 μM ASK1 kinase domain with increasing concentrations of ASK1(269–658) added. MKK6 was held constant (3 μM), and phosphorylation was monitored by Western blot analysis. Total protein transferred to membranes visualized by staining membrane with Ponceau S (shown below). (D) Quantitation of the independent triplicate experiments shown in C. Each band was normalized to the band intensity of the kinase-alone 10-min time point for that experiment. Mean values are plotted with error bars representing the SEM. (E) MKK6 phosphorylation by 0.01 μM ASK1 kinase domain with increasing concentrations of ASK1(88–266) added. MKK6 was held constant (3 μM), and phosphorylation was monitored by Western blot analysis. Total protein transferred to membranes visualized by staining membrane with Ponceau S (shown below). (F) Potential model of MKK6 priming. (Left) Crystal structure of unphosphorylated MKK6 (PDB ID code 3VN9), with the αC helix in orange, the activation loop in blue, and buried phosphorylation target residues shown as spheres. (Right) A model of MKK6 based on PDB 3fme, which shows a markedly different αC-helix conformation and has a disordered activation loop. In this figure, the loop was modeled using MODELER (76).

