Fig. S6.
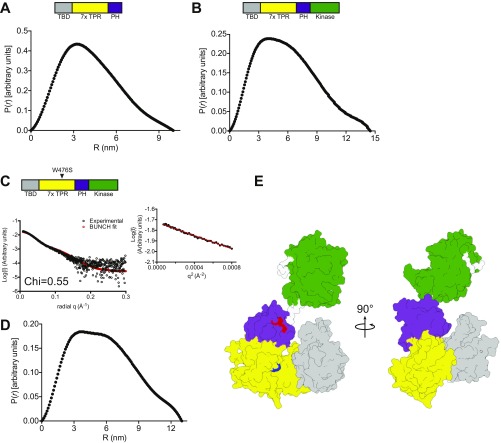
(A and B) Interatomic distance distributions of ASK1(88–658) (A) and ASK1(88–941) (B). (C) Overlay of experimental scattering data (black circles) and scattering profile calculated using BUNCH for the model of ASK1(88–941) W476S. A Guinier plot for the dataset is shown below, indicating that aggregates do not measurably contribute to the scattering profile. (D) Interatomic distance distributions of ASK1(88–941) W476S. (E) Surface representation of the BUNCH model of ASK1(88–941) W476S, with the thioredoxin-binding domain in gray, the TPR region in yellow, and the pleckstrin homology domain in purple. Residues that affect activity when mutated are indicated in red (F623 and D632) and blue (W476). Agreement between the experimental data and the calculated scatter pattern is indicated by χ = 0.55.

