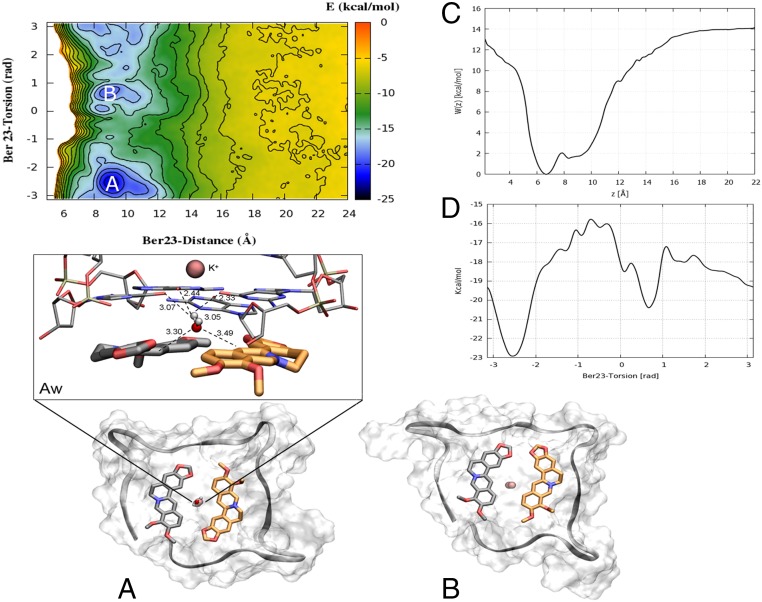
Fig. 5.
The FES of berberine/G4-DNA computed as a function of d (in angstroms) and π (in radians) CVs. Isosurfaces are shown every 2 kcal/mol. (A) The deepest energy basin A represents a binding mode very similar to the crystallographic one, in which Ber23 (orange sticks) assumes an antiparallel orientation with respect to Ber24 (gray sticks). (Aw) Most of the conformations found in basin A are characterized by the presence of one water molecule located between the residues Ber24, Ber23, and the G-tetrad plane making C-H···O hydrogen bonds with the aromatic C3 carbons of Ber24 and Ber23 in a very similar position as found by X-ray. The distance between atoms is measured in the most populated conformation representative of the lowest energy basin A. Additional H-O-H···O hydrogen bonds are engaged with the O6 atoms of the G-tetrad plane. (B) The second deepest energy minimum represents an alternative binding mode where Ber23 orientation is parallel with respect to Ber24. G4-DNA is displayed as gray surface, and the backbone in gray ribbon. K+ ions are depicted as pink spheres. Ber25 and Ber26 are omitted for clarity. (C) Potential of mean force (PMF) W(z) computed along the axis of the funnel z using the reweighting algorithm (52). The region with the ligand bound is defined as 5 ≤ z ≤ 11 Å, whereas the ligand fully solvated state is at z = 20 Å. (D) Monodimensional free energy as a function of Ber23 π (in radians).

