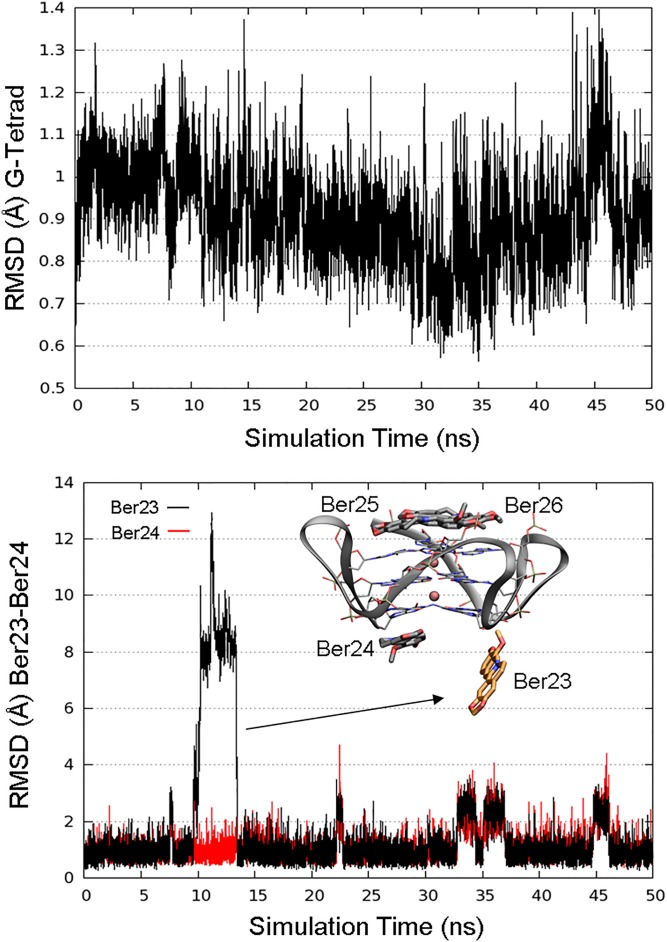
Fig. S1.
(Upper) RMSD plot of the G-tetrads along 50 ns of MD simulation. (Lower) RMSD plot of Ber23 (orange sticks). After ∼10 ns of MD simulation, Ber23 assumes a conformation almost perpendicular to the G-tetrad, recovering the original position after 3–4 ns. Residues Ber24, Ber25, and Ber26 are shown as gray sticks. K+ cations are depicted as pink spheres.

