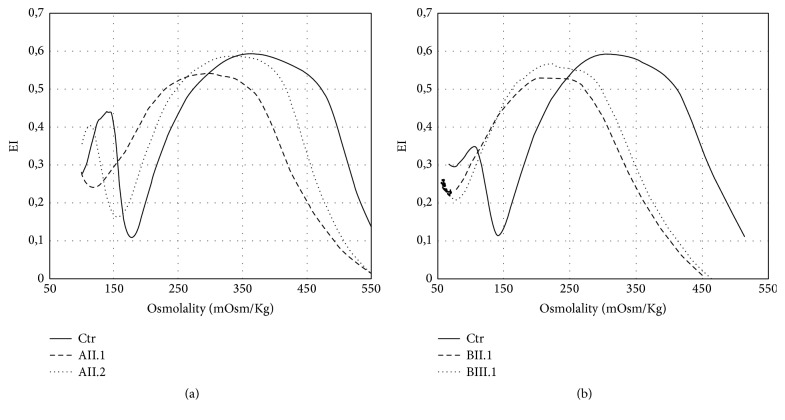
Figure 3.
Results of LoRRca Osmoscan analysis in the affected patients compared to a normal control performed by Laser-Assisted Optical Rotation Cell Analyzer (LoRRca MaxSis, Mechatronics, Hoorn, The Netherlands). The osmotic gradient curves reflect RBC deformability as a continuous function of suspending medium osmolality. The following parameters were evaluated: EImax (maximal deformability, reflecting mean cellular surface area), Omin (osmolality at which deformability reaches its minimum, reflecting mean cellular surface-to-volume ratio), and Ohyper (the osmolality in the hypertonic region corresponding to 50% of the EImax, reflecting mean cellular hydration status).

