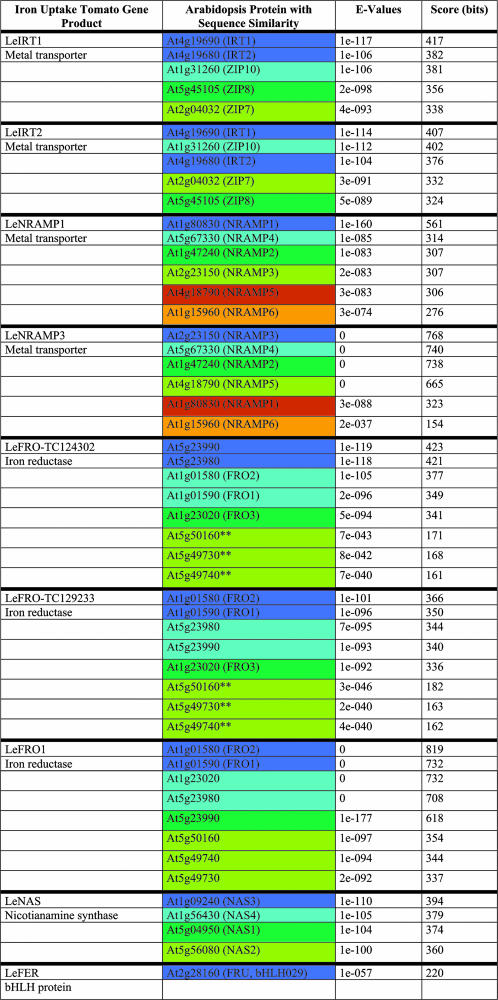
Table I.
Amino acid sequence comparisons of tomato and Arabidopsis homologs and alignment results using BLASTP at http://www.arabidopsis.org/Blast
Arabidopsis iron uptake homologs were only represented and considered for further analysis if they showed E-values similar to the best hits. The only exceptions to this were three FRO proteins marked by **, which were retained due to their map position. For the purpose of highlighting tomato-Arabidopsis conserved gene clusters in Figure 3, the iron uptake genes were marked by a color code (compare Table I with Fig. 3 and Supplemental Table I). Arabidopsis iron uptake homologs located within a distance of ±400 genes (about ±2 Mb) were marked by the same color (e.g. At4g19680-IRT2 and At4g19690-IRT1). Homologous Arabidopsis iron uptake genes that were located in different regions of the genome (at a distance of more than 400 genes) were highlighted by different colors. The best hits were highlighted in dark blue, thereafter in light blue, dark green, light green, brown-orange, and light orange.

