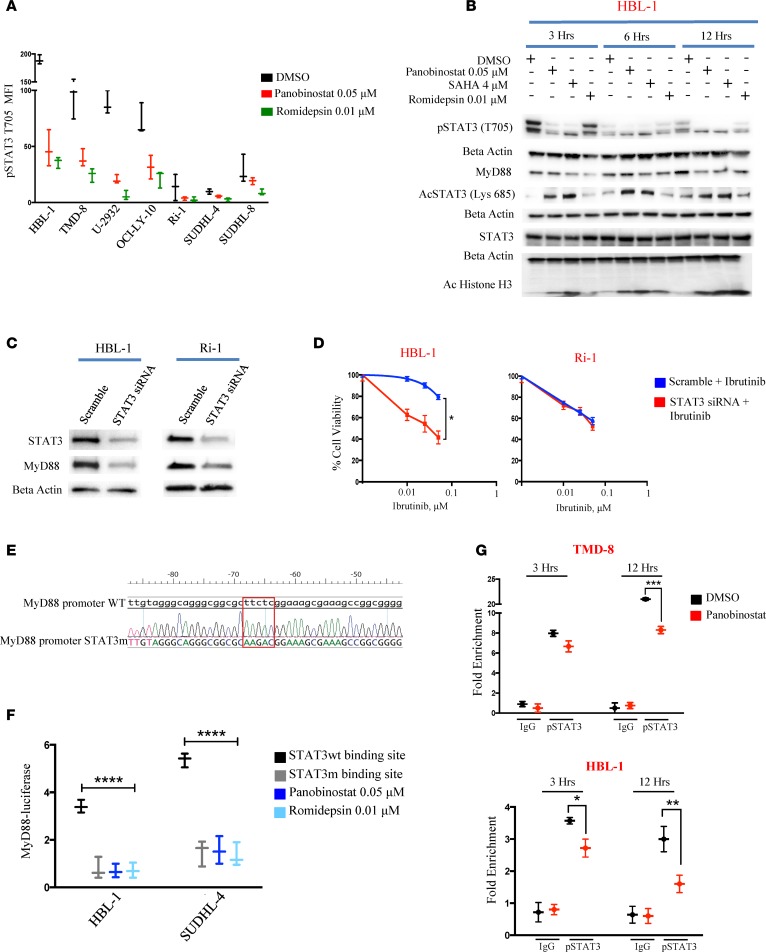
Figure 3. STAT3 plays a central role in modulating MyD88 expression.
(A) Box and whiskers plot showing decrease of pSTAT3 (T705) in B cell lymphoma cell line panel (ABC n = 5 and GCB n = 2) after treatment with either 0.05 μM panobinostat or romidepsin 0.01 μM for 12 hours. Error bars represent SEM of triplicates. (B) Western blot showing the concomitant decrease of pSTAT3 (T705) and MyD88 and increase in acetylation of STAT3 (Lys 685) in HBL-1 cells after treatment with either panobinostat (0.05 μM), SAHA (4 μM), or romidepsin (0.01 μM) for 3, 6 and 12 hours. Duplicate samples run on parallel gels are shown. (C) Western blot showing the effects of STAT3 depletion by RNA interference on MyD88 levels in HBL-1 and Ri-1 cells. Both cells were treated with 2 μM scramble or STAT3 siRNA for 48 hours, and the effects on the expression levels of STAT3 and MyD88 were assessed by Western blotting. (D) HBL-1 and Ri-1 cells transfected with 2 μM scramble, and STAT3 siRNA were incubated with increasing concentrations of Ibrutinib (0.1, 0.25, 0.5 μM). Cell viability assessed by MTS assay after 48 hours. STAT3 siRNA + Ibrutinib viability data were normalized to the effect of STAT3 siRNA alone. Error bars represent SEM of triplicate experiments. Differences between groups were calculated with the Student t test. *P = 0.01. (E) Analyses of DNA sequences of a MyD88 promoter WT and MyD88 promoter with STAT3 binding site mutation, showing the replacement of reference sequence TTCTC with AAGAC. (F) Box and whiskers plot showing decrease in luciferase activity in the cells with STAT3 mutant binding site compared with the WT MyD88 promoter. No further decrease in luciferase activity is observed in the mutant cells treated with indicated concentration of either panobinostat or romidepsin for 12 hours. Error bars represent SEM of triplicates. Differences between groups were calculated with 2-way ANOVA with Bonferroni’s test. ****P < 0.0001. (G) TMD-8 and HBL-1 cells were treated with either panobinostat (0.05 μM) or DMSO, and ChIP was performed with pSTAT3 (T705) antibody or control IgG. Primers to amplify the STAT3-binding regions of the MyD88 promoter were used in qPCR to determine fold enrichment relative to a noncoding region. Error bars represent SEM of 3 independent experiments. ANOVA with Dunnett’s test was performed to compare STAT3 WT binding site versus the other conditions. *P < 0.05; **P < 0.005; ***P < 0.0005.

