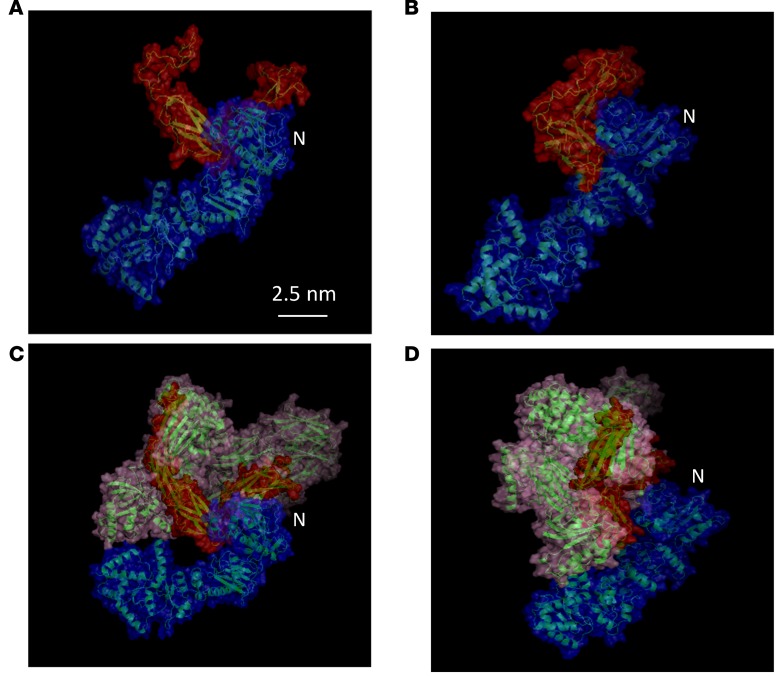
Figure 5. Atomistic models of the Gp96-C3 complex.
The N-terminus of Gp96 is indicated. Each structure is represented by a transparent surface superposed to the ribbon diagram of the protein backbone. The color code is the following: red for the C3 fragment (749–955), blue for the Gp96 and pink for the C3 complementary structure (1–748; 956–1641). (A and B) Two views of the Gp96-C3 fragment model. (C and D) Two views of the Gp96 full-length C3 model. This figure was prepared with PyMOL (http://www.pymol.org). N = N-terminal domain.

