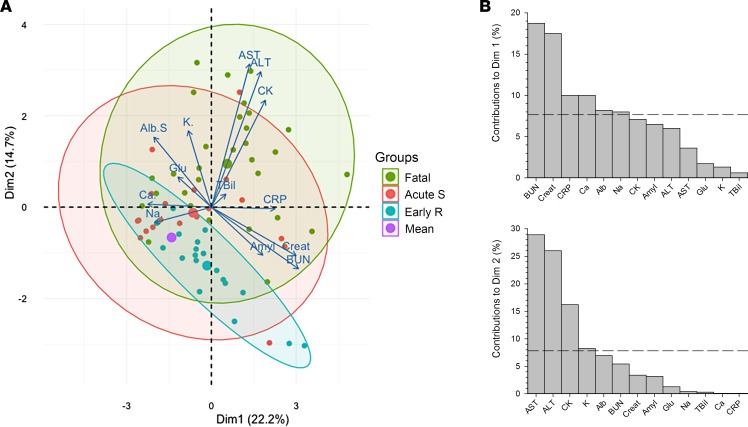
Figure 5. Principal component analysis of biological parameters throughout the course of the disease.
Principal component analysis (PCA) of 13 different biological parameters in 3 distinct populations was performed. PCA is used to summarize the information contained in continuous multivariate data by reducing the dimensionality of the data without losing any important information. Samples obtained from surviving Ebola virus disease (EVD) patients during the symptomatic phase (i.e., 0–13 days after onset of symptoms) (Acute S) or during early recovery (more than 13 days after onset of symptoms) (Early R) and from fatal EVD patients (Fatal) were classified in 3 distinct groups on a 2-dimensional visualization plot of this PCA (A). The variables driving the transition between these populations, thus linked to prognosis, are represented by arrows. The purple circle represents the mean of the 3 populations. Contributions of these factors to dimensions 1 and 2 are represented in B.

