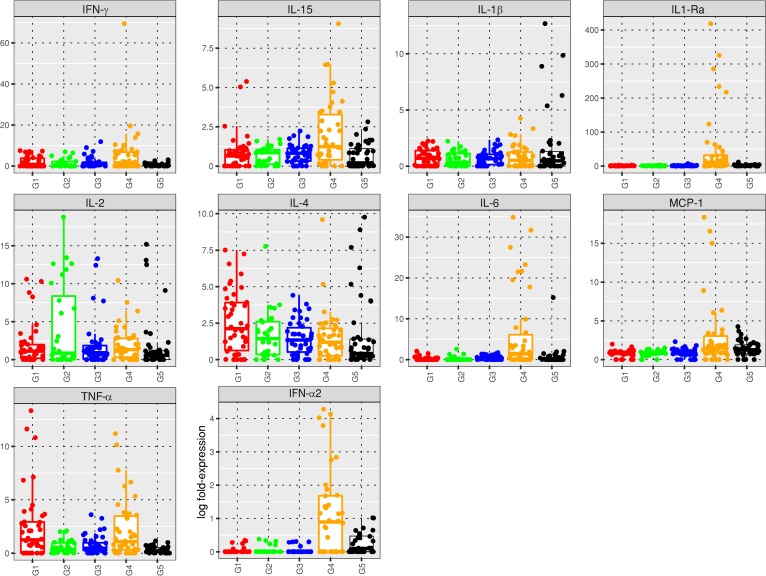
Figure 11. Box plot and plot-jittering representations of the cytokine levels reached in plasma of macaques within 1 week after exposure to WT CHIKV after vaccination (G1 to G4) or Δ5 attenuated virus (G5, safety study).
Animals were inoculated with virus on day 0, which corresponded to day 123 of immunization schedule for groups G1 to G4. G1 = 1× Δ5 virus (red), G2 = DD (green), G3 = DM (blue), G4 = control saline (orange), G5 = safety study (black). For each cytokine, the box plots show the first and third quartiles, together with the medians of the cytokine expressions.

