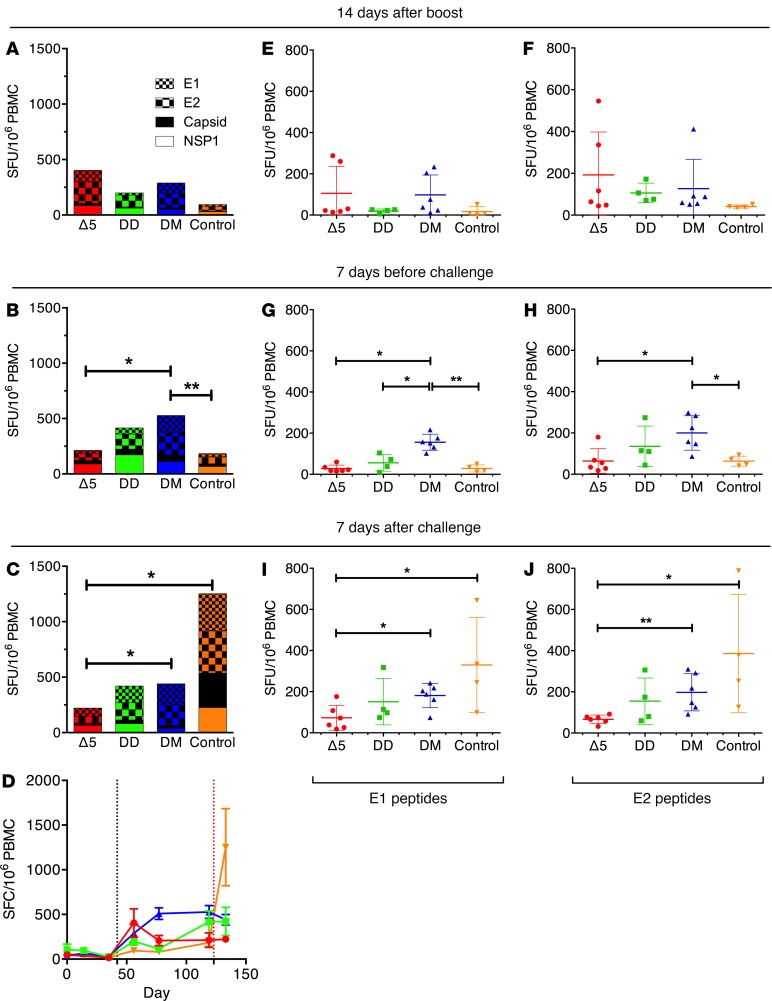
Figure 4. CHIKV-specific T cell responses induced by CHIKV vaccine candidates.
Δ5, attenuated virus (n = 6) (red); DD, homologous prime-boost (n = 4) (green); DM, heterologous prime-boost (n = 6) (blue); Control, no vaccine but NaCl injection only (n = 4) (orange). Panels compare the sum of IFN-γ T cell responses from each group measured by FluoroSpot assays on PBMC collected at 14 days after boost (A), 7 days before challenge (B), and 7 days after challenge (C) and stimulated with envelope E1 and E2, Capsid, and nsP1 peptide pools. Statistical comparisons were performed at 14 days after boost, 7 days prechallenge, and 7 days after challenge. Panel D compares cumulated IFN-γ responses against all peptides for each group (mean ± SEM). Animals were immunized on days 0 and/or 42 (y axis and black vertical dotted line) and challenged on day 123 (red vertical dotted line). CHIKV-specific IFN-γ T cells responses against E1 (E, G, I) and E2 (F, H, J) peptide pools at 14 days after boost (E and F), 7 days before challenge (G and H), and 7 days after challenge (I and J). Panels show IFN-γ responses in individual animals with mean (± SEM). For statistical analyses, the Kruskal-Wallis test followed by the Mann-Whitney U test were used to identify differences between groups. Significance is represented by *P < 0.05 or **P < 0.01; 95% CI.

