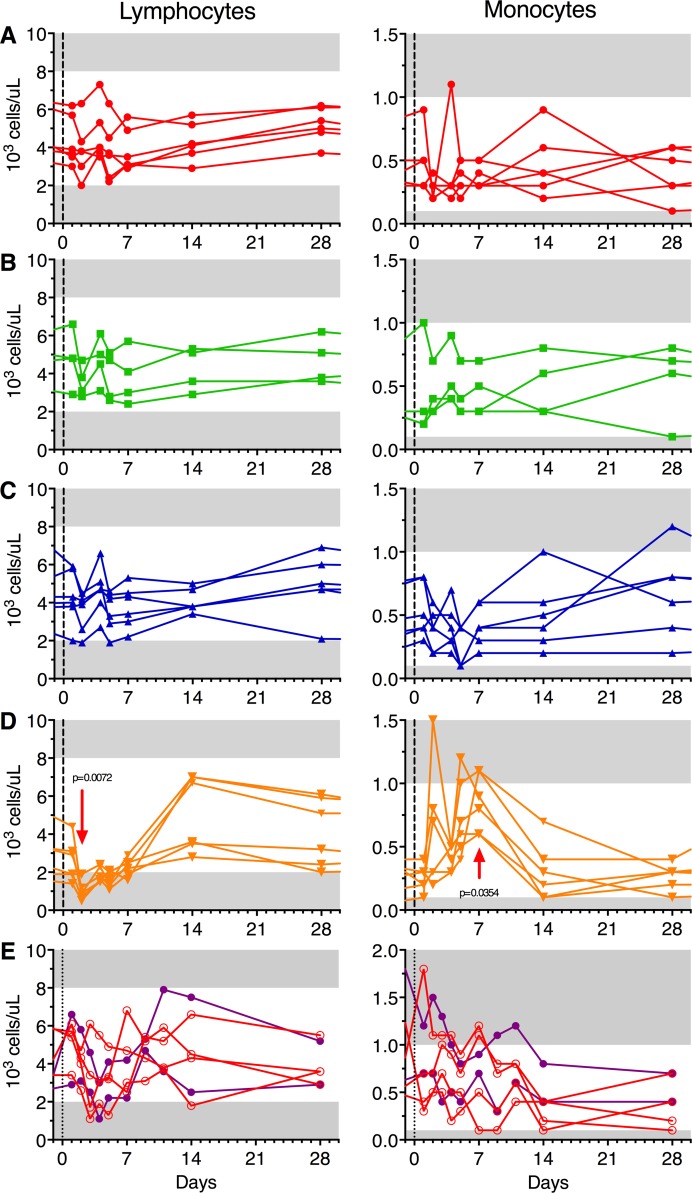
Figure 8. Vaccines protect against WT Chikungunya–induced lymphopenia and monocytosis.
White blood cell subset absolute counts at each bleeding point after challenge. Animals were immunized with Δ5 virus (A; red), DD (B; green), DM (C; blue), or saline (D; orange) and challenged at day 0 (black vertical dotted line corresponding to day 123 in the Figure 1 schedule). Panel E shows animals that were infected with Δ5 virus at day 0 either s.c. (clear red circles; n = 4) or s.c. in the wrist (SCw, filled purple dots; n = 2). Horizontal gray area on panels represent the values out of normal range (lymphocytes normal range: 2 × 10³ to 8 × 10³ cells/μl; monocytes normal range: 0.1 × 10³ to 1 × 10³ cells/μl). Statistics by Friedman + Dunn’s post test for multiple comparison of time point values to baseline.

