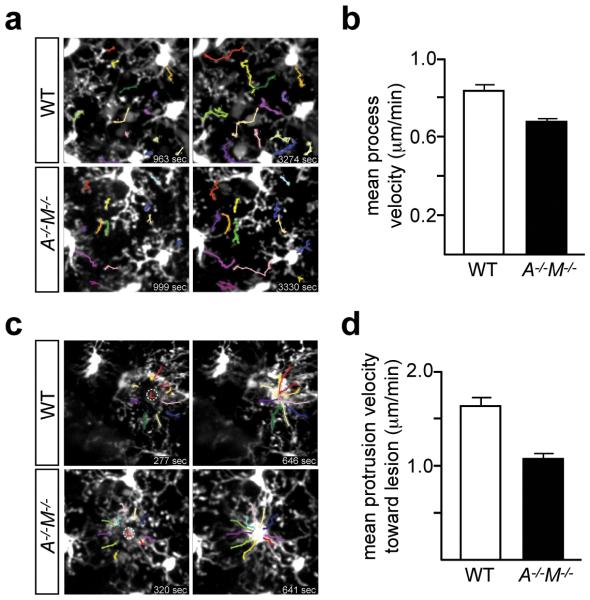
Figure 3.
TAM signaling regulates microglial process extension velocity and response to vascular injury. a, Two video stills for WT (top row) and Axl−/−Mertk−/− (A−/−M−/−, bottom row) Cx3cr1GFP/+ mice, with tracking of individual GFP-labeled processes (color-coded) in the unperturbed visual cortex, by live two-photon imaging. Stills are from Supplementary Videos 2 (WT) and 3 (A−/−M−/−), and indicated times are from the start of the video. b, Mean process velocity (± SEM) in the absence of perturbation. n = 53 measurements in 3 WT mice, and n = 42 measurements in 3 A−/−M−/− mice; Two-tailed unpaired Mann Whitney p= 0.0004. c, Two video stills for WT (top row) and A−/−M−/− (bottom row) Cx3cr1GFP/+ mice, illustrating microglial process tracking (color-coded) toward a laser-induced rupture of a brain microvessel (circled L) by two-photon imaging. Stills are from Supplementary Videos 4 (WT) and 5 (A−/−M−/−), and indicated times are from the generation of the laser lesion. d, Mean process extension velocity (± SEM) toward the lesion site. n = 20 measurements performed in 2 WT mice and n = 30 measurements performed in 3 A−/−M−/− mice; Two-tailed unpaired Mann Whitney p= < 0.0001.

