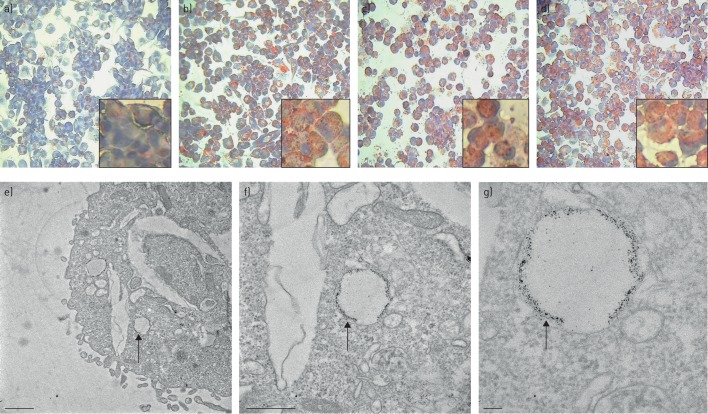
FIGURE 1.
PMA/THP-1 lipid uptake. PMA/THP-1 cells were incubated with 10% vol/vol Calogen for 24 h with and without inhibitors and were stained with ORO to detect lipid accumulation. a) Untreated cells were compared with b) cells treated with Calogen alone and c) in the presence of cytochalasin D and d) CD36 monoclonal blocking antibody. Inset images are magnified representative regions of each treatment. e) Cells treated with Calogen were also visualised under TEM. Scale bar=1 μm. f, g) Lipid droplets were identified and magnified to reveal dark stained remnants of lipid encased in membrane-bound vesicles, as indicated by the arrows. Scale bars=500 nm (f) and 100 nm (g).

