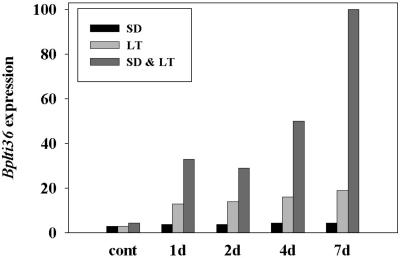
Figure 4.
The accumulation of Bplti36 mRNA in birch leaves under SD (12 h light, 18°C), LT (24 h light, 4°C), and SD plus LT (12 h light, 4°C, LT preceded by 7 d in SD). Histograms show the normalized values (after standardization to ribosomal signal intensities) presented as percentage of the highest value (7 d in SD plus LT).

