
Figure 3. Antitumor Efficacy of 5E5 CAR T Cells In Vitro and In Vivo.
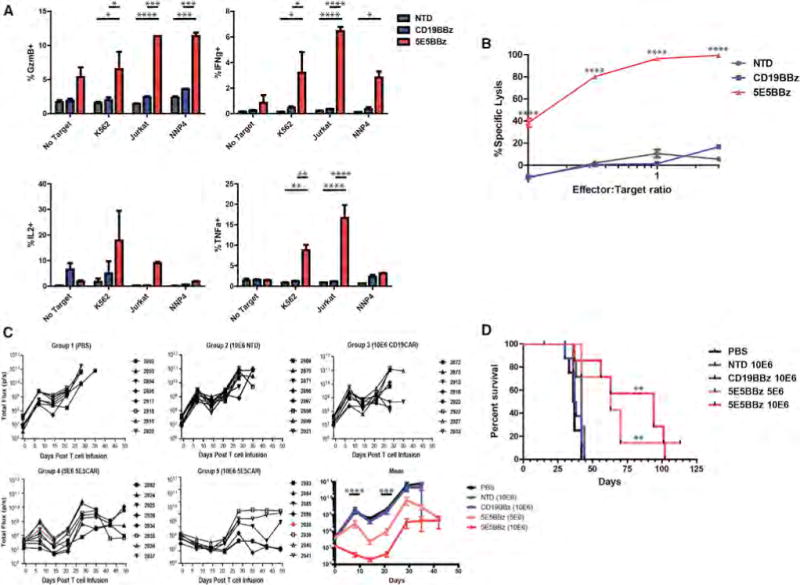
(A) Analysis of the cytokine-producing T cells from an intracellular cytokine assay of T cells, CAR-transduced or non-transduced (NTD), cultured with K562, K562-meso, Jurkat, and NNP4 cells. NNP4 is a sample of primary epithelial ovarian cancer cells obtained from a pleural tap. * = p < 0.05, ** = p < 0.01, *** = p < 0.001, **** = p < 0.0001. Data are plotted as mean ± SEM.
(B) In vitro cytotoxicity assay of T cells, 5E5 CAR, CD19 CAR, or NTD, cultured with Jurkat cell line at the indicated effector-to-target ratios. **** = p < 0.0001
(C) Serial bioluminescence imaging of NSG mice injected intravenously with 5 × 10⁶ CBG+ Jurkat cells and infused with PBS or the indicated T cells, 1 × 10⁷ or 5 × 10⁶ cells as indicated, 8 days after tumor engraftment. Two mice, one in group 4 and one in group 5, died due to conditions not related to treatment and are indicated as red lines. The bottom right panel displays the mean bioluminescence by treatment group. n = 8 mice per group. See also Figure S4A. Statistical significance calculated between CD19 CAR and 5E5 CAR (5 × 10⁶ and 1 × 10⁷). There is no significance observed between 5 × 10⁶ and 1 × 10⁷ dose of 5E5 CAR. *** = p < 0.001, **** = p < 0.0001.
(D) Kaplan-Meyer survival curve of mice bearing Jurkat tumor by treatment group. Median survival of PBS group = 36.5, NTD group = 42, CD19 CAR group = 37.5, 5 × 10⁶ 5E5 CAR group = 63 and 1 × 10⁷ 5E5 CAR group = 94 days post T cell infusion. Comparison of survival of CD19 CAR group to 5 × 10⁶ 5E5 CAR group is p = 0.0016 and for 1 × 10⁷ 5E5 CAR group is p = 0.0014. No statistical significance between 5E5 CAR doses.