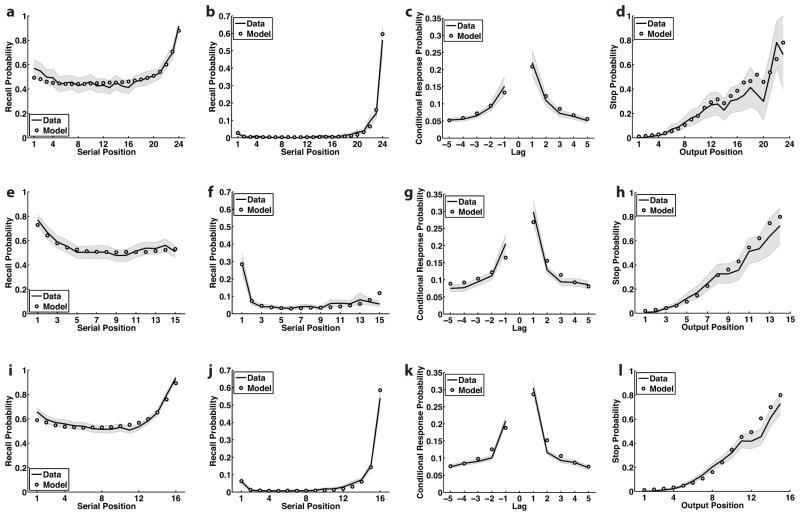
Figure 4.
Measures of recall behavior, for the observed data and for model simulations. Top row: Experiment 1; middle row: Experiment 2; bottom row: Experiment 3. (a) Recall probability as a function of serial position, for the data from Experiment 1 and the best-fitting model with no semantic associations. (b) Probability of starting recall with each serial position. (c) Conditional response probability as a function of lag. (d) Stop probability by output position. (e–h) Same measures as above, for Experiment 2. (i–l) Experiment 3. Shaded areas indicate 95% confidence intervals for the observed data.

