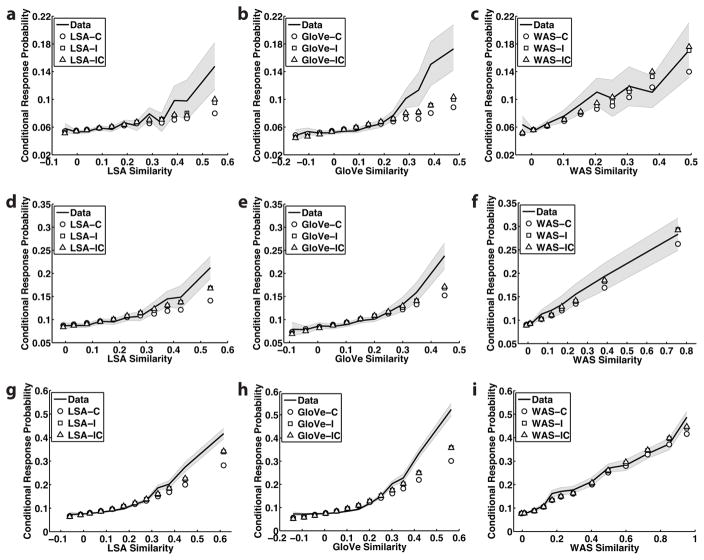
Figure 5.
Measures of semantic organization, for the observed data and for model simulations. Top row: Experiment 1; middle row: Experiment 2; bottom row: Experiment 3. (a) Conditional response probability as a function of latent semantic analysis (LSA) semantic similarity bin. The line indicates the mean value in the data, and the shaded region represents the 95% confidence interval. Also shown is the performance of the LSA-based models. C: context-based semantic cuing; I: item-based semantic cuing; IC: combined item and context-based semantic cuing. (b) Conditional response probability as a function of global vectors (GloVe) semantic similarity bin. (c) Conditional response probability as a function word association spaces (WAS) semantic similarity bin. (d–f) Conditional response probability by semantic similarity bin for Experiment 2. (g–i) Experiment 3.

