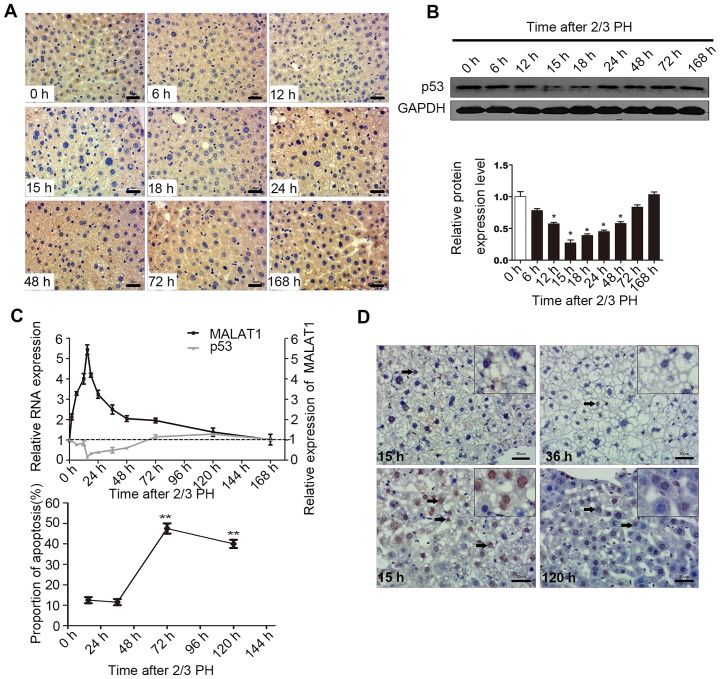
Figure 5.
p53 protein negatively regulates metastasis-associated lung adenocarcinoma transcript 1 (MALAT1) in hepatocytes. (A) Representative images showing the p53 protein levels detected by immunohistochemistry (IHC) at different time points following 2/3 partial hepatectomy (PH) (scale bars, 30 μm). (B) Western blot analysis of the changes in p53 protein expression at different time points following 2/3 PH. The graph in the bottom panel shows the percentage gray value in each band relative to the control. (C) The expression of p53 and MALAT1 in mouse liver samples was detected by RT-qPCR following 2/3 PH. (D) The proportion of cells undergoing apoptosis following 2/3 PH. All the results were reproduced in at least 3 independent experiments. The data are presented as the means ± SD of 3 independent experiments. *p<0.05, **p<0.01 vs. the 0 h time point. The boxes (insets) on the top right of the images indicate local amplification in order to let the reader see more clearly. The arrows in the images indicate apoptosis cells.

