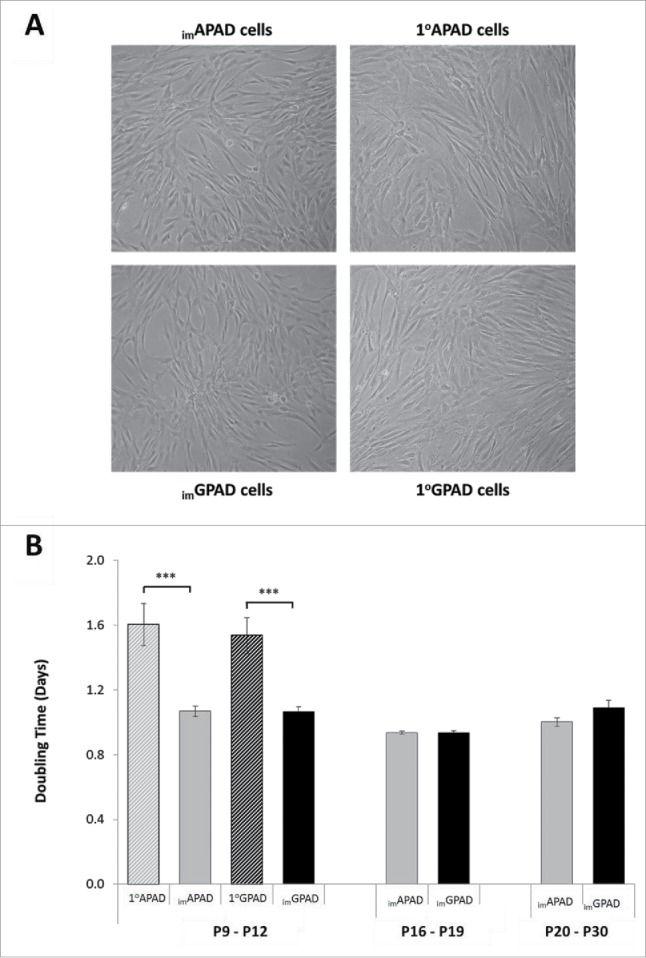
Figure 2.

Proliferation of imAPAD and imGPAD cell lines. (A) Light microscopy of proliferating imAPAD and imGPAD cell lines compared with 1°APAD and 1°GPAD cells (x 100 magnification). (B) Cell doubling time of paired imAPAD/imGPAD cell lines was compared with 1°APAD/1°GPAD cells (passage 9–12). Proliferation rates were examined up to passage 30 for imAPAD/imGPAD cells but 1°APAD and 1°GPAD cells failed to proliferate after passage 14 (n = 6–8, mean ± SEM; ***P < 0.001; paired samples t-test for cell line vs. primary cells).
