Figure 7.

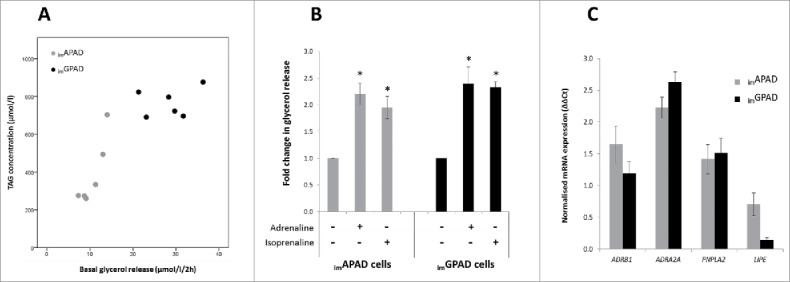
Lipolysis in imAPAD and imGPAD cell lines. (A) Basal glycerol release plotted against total TAG content in imAPAD and imGPAD cell lines (passage 16–17). (B) Catecholamine-stimulated glycerol release in imAPAD and imGPAD cells relative to basal glycerol release. Cells were treated with 5 mM KRH buffer containing either adrenaline (100nM) or isoprenaline (100nM) (n = 3, mean ± SEM, normalized for total TAG content; *P < 0.05, Wilcoxon signed-rank). (C) mRNA expression of adrenergic receptors and lipases at day 14 of adipogenic differentiation in imAPAD and imGPAD cells (passage 8–9). Data are shown as ΔΔCt values (normalized to PPIA and PGK1; n = 6, mean ± SEM).
