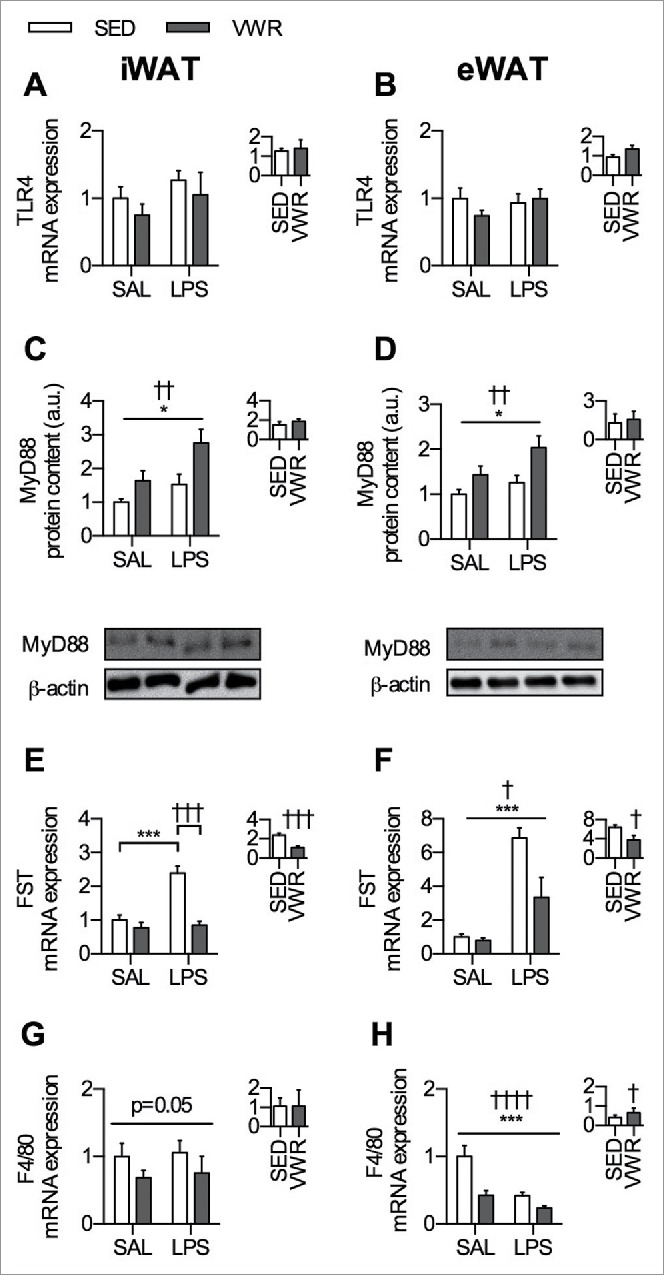
Figure 5.

Potential molecular targets that may mediate the protective effects of VWR against LPS induced inflammation. TLR4 mRNA expression in A) iWAT and B) eWAT. MyD88 protein content in C) iWAT and D) eWAT with representative blots shown below. FST mRNA expression in E) iWAT and F) eWAT. F4/80 mRNA expression in G) iWAT and H) eWAT. The inset figure within each panel indicates the relative change induced by LPS within SED and VWR groups. Data is presented as mean ± sem (n = 6–10/group). A two-way ANOVA main effect (indicated by a flat bar) and post-hoc testing of significant interactions (indicated by lines with ticks) have significance displayed for LPS as *p < 0.05 and ***p < 0.001 and for VWR as †p < 0.05, ††p < 0.01, †††p < 0.001, or ††††.0001.
