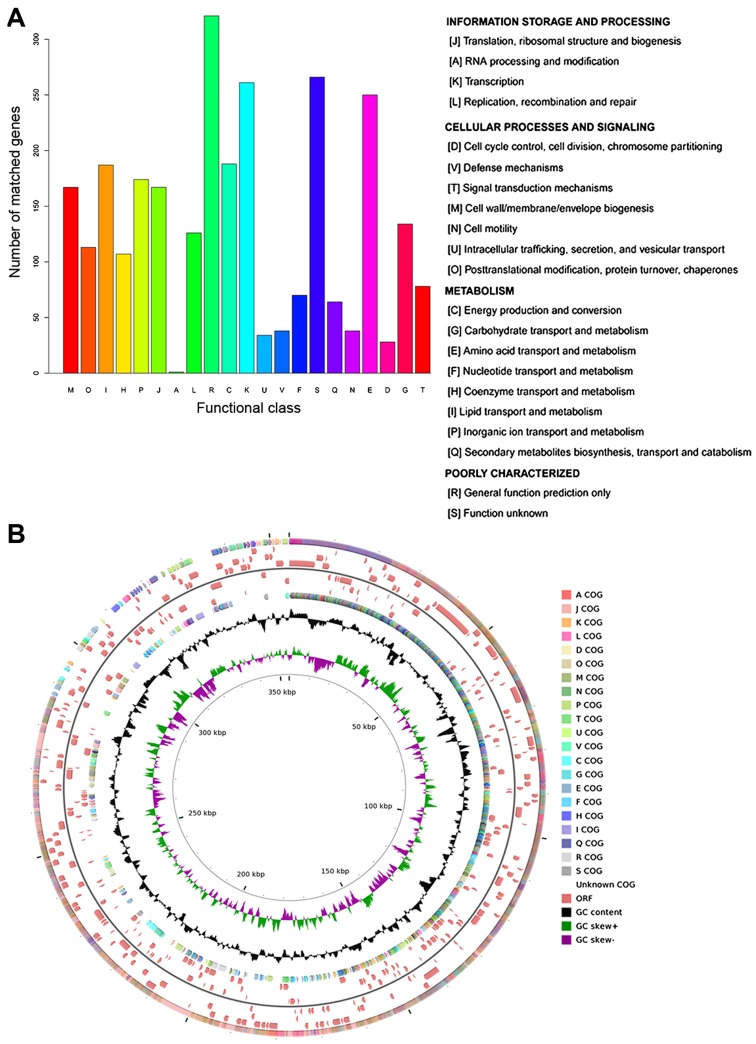
Figure 1.
The functional annotation of the genomic sequence of Acinetobacter baumannii (A. baumannii) MDR-SHH02 using the Cluster of Orthologous Groups (COGs) of proteins database. (A) The bar diagram displaying the COG categories. The x-coordinate represents the COG categories, and y-coordinate represents the number of matched genes; (B) the annotation circle displaying the distribution of COG categories, open reading frames (ORFs) and GC content in the genomic sequence of A. baumannii MDR-SHH02. The outermost circle (circle 1) displays the distribution of COG categories on positive strand, and each kind of color represents one COG term, which is annotated as that in (A). Circles 2–4 and 5–7 display the distribution of ORFs on positive and negative strands. Circle 8 displays the distribution of COG categories on negative strand. Circle 9 displays the GC content. Circle 10 displays the GC skew (G-C)/(G+C) (green bars represent positive values, purple bars represent negative values). Circle 11 dislays the the scale in kbp.

