Figure 1.

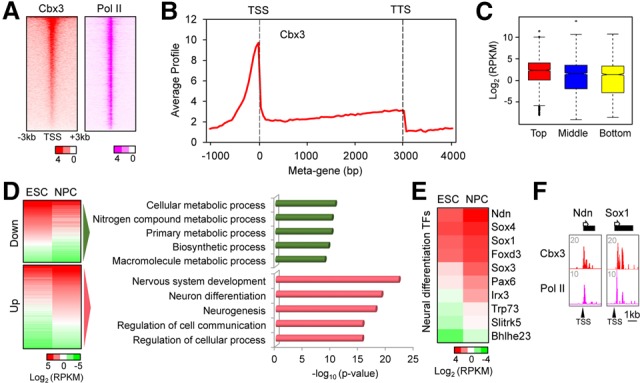
Association of Cbx3 with promoters during neural differentiation. (A) Heat map of Cbx3 and Pol II enrichment at NPC promoters. P-values of enrichment were plotted and ranked by Cbx3. (B) Metagene profile of Cbx3 enrichment in NPCs. The Y-axis is the average signal from 50-base-pair windows. (C) Box plot of gene expression level in high (red), middle (blue), and bottom (yellow) Cbx3-bound genes. Log2 expression levels are reads per kilobase per million mapped reads (RPKM) from NPC RNA sequencing (RNA-seq) data. Bound genes contained Cbx3 within a ±1-kb region flanking the transcription start site (TSS). (D, left) Gene expression heat maps of Cbx3-bound and either down-regulated or up-regulated genes during differentiation from ESCs to NPCs. (Right) Gene ontology analysis for Cbx3-bound and down genes or up genes. Regulated genes displayed a >1.5-fold change in NPCs versus ESCs. (E) The RNA-seq heat map shows Cbx3-bound up-regulated neural differentiation transcription factors (TFs) from the term “nervous system development” in D. (F) Browser track examples of Cbx3 and Pol II cobound transcription factor promoters in NPCs.
