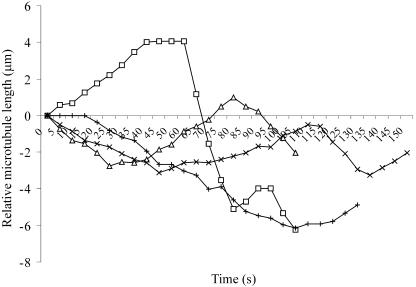
Figure 1.
Life History Plots of Individual Cortical Microtubule Plus-Ends.
Microtubule dynamics were visualized in MBD-DsRed–expressing cells by time-lapse microscopy using 1-s exposures to capture images at 5-s intervals for several minutes. The change in length, relative to the starting position, of individual microtubule plus-ends was determined frame-by-frame and used for the life history plots. The life history plots of four separate cortical microtubules are shown. Dynamic instability parameters were determined for each microtubule using the life history plots and the criteria described in Methods.

