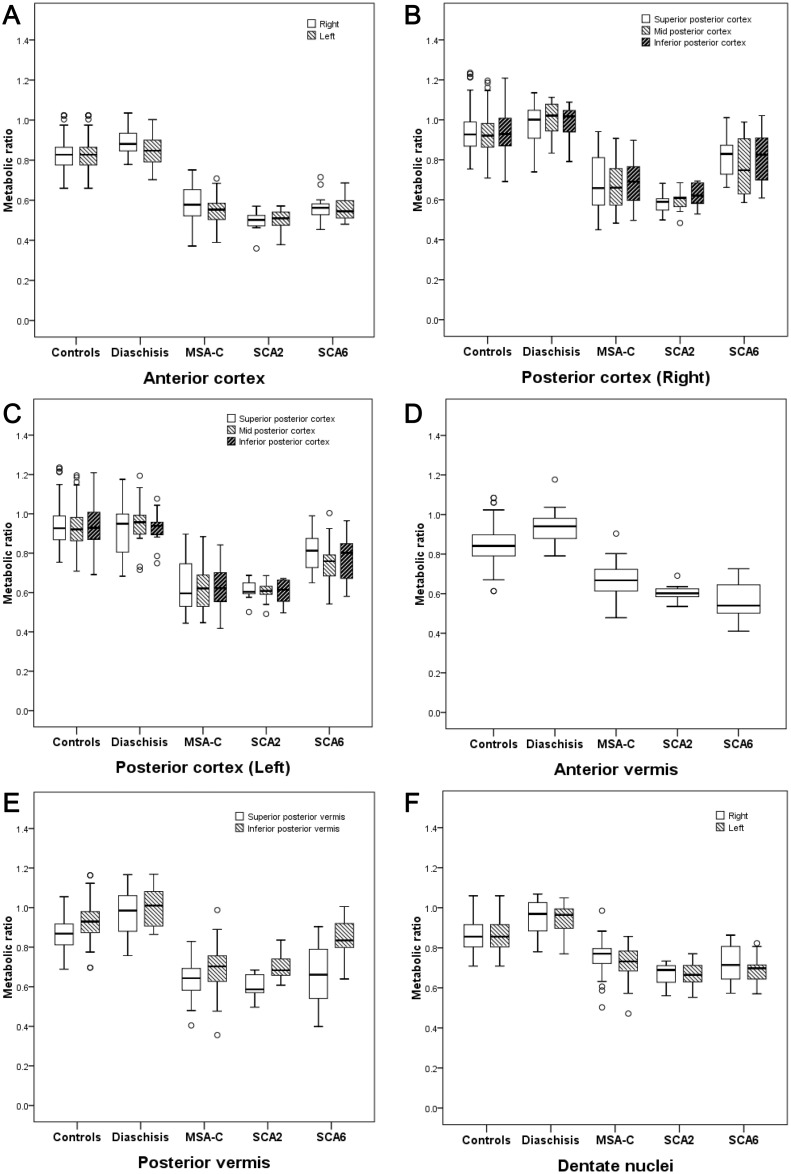
Fig 3. Subregional metabolic ratios in normal controls and disease groups.
Metabolic ratios of anterior cortex (A), anterior vermis (B), right posterior cortex (C), left posterior cortex (D), posterior vermis (E), and dentate nuclei (F) were decreased in patients with multiple system atrophy of the cerebellar type (MSA-C) and spinocerebellar ataxia (SCA) type 2 and 6, compared to normal controls and those with crossed cerebellar diaschisis.

