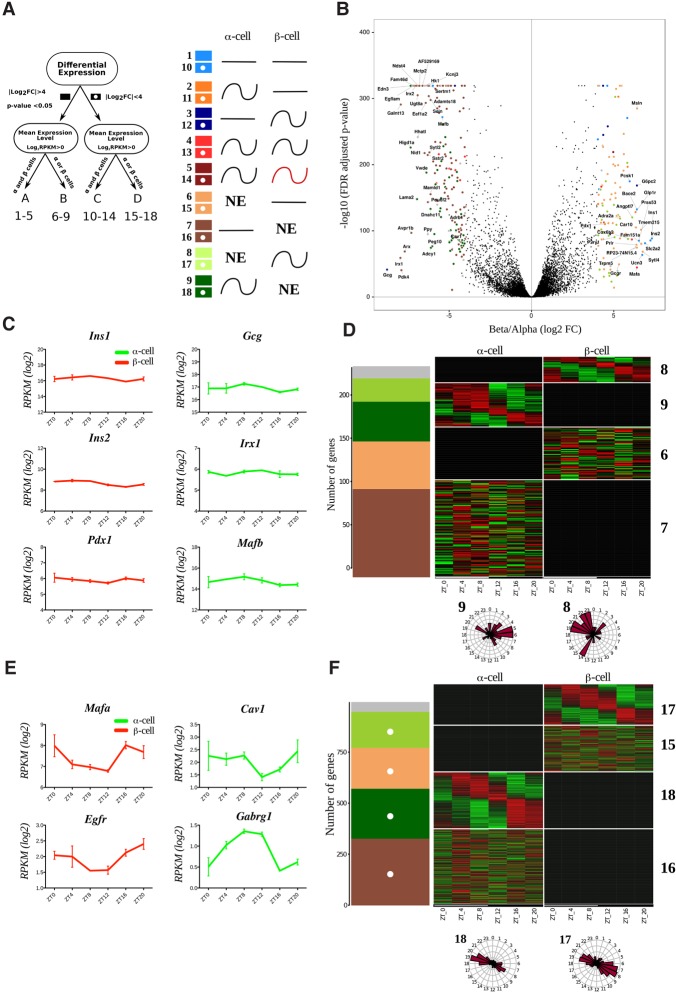
Figure 1.
Temporal pattern of transcripts differentially expressed in α and β cells. (A) Groups and models assigned to transcripts with respect to their differential expression and rhythmic pattern. Transcripts with expression levels of log2 RPKM > 0 in at least one of the cell types were considered as expressed in this cell type and nonexpressed (NE) in the other cell type. Genes with expression differences >16-fold (absolute log2 fold change >4; FDR-adjusted P-value < 0.05) between two cell types were considered as differentially expressed (groups A and B; solid-colored squares), while those with expression level differences <16-fold were considered as nondifferentially expressed (groups C and D; squares with white dots). We therefore obtained four independent groups of genes: group A (differentially expressed α-cell- and β-cell-specific transcripts detectable in both cell types), group B (differentially expressed α-cell- and β-cell-specific transcripts expressed in one single cell type), group C (genes expressed in α and β cells with lower fold change), and group D (genes in one single cell type with lower fold change). Based on harmonic regression with a period of 24 h, model selection to assess rhythmicity was applied to these four groups. An arbitrary threshold of 0.4 was set on BIC weight (BICW). Genes were assigned to one of the nine pairs of models: groups A and C: genes defined as nonrhythmic (models 1 and 10), genes defined as rhythmic in α cells (models 2 and 11), genes defined as rhythmic in β cells (models 3 and 12), genes defined as rhythmic in both cell types with similar parameters (models 4 and 13), and genes defined as rhythmic in both cell types with different parameters (models 5 and 14); and groups B and D: genes expressed in β cells only and defined as nonrhythmic (models 6 and 15), genes expressed in α cells only and defined as nonrhythmic (models 7 and 16), genes expressed in β cells only and defined as rhythmic (models 8 and 17), and genes expressed in α cells only and defined as rhythmic (models 9 and 18). (NE) Gene is not expressed. Genes with lower BICWs were considered as undefined (model 0) and are represented as a gray bar in D and F. (B) Volcano plot presenting the transcripts differentially expressed in α cells (log2 fold change less than −4) or β cells (log2 fold change >4). Differentially expressed genes are identified by colored dots corresponding to their respective model. (C,E) Temporal expression profiles for selected nonrhythmic (C) and rhythmic (E) transcripts differentially expressed in β cells (left) and α cells (right). Only the profile on the higher-expression cell type is shown. Data represent the mean of two biological replicates per time point (each replicate is a mix of cells from six mice). Error bars express the SD of two independent experiments. (D,F) Rhythmic expression heat maps for transcripts of groups B and D. The number of genes distributed by models (described in A) is depicted in the left panel. (Right panels) Corresponding heat maps showing relative expression indicated in green (low) and red (high). Phase distribution of rhythmic genes is presented in the adjacent polar histograms.

