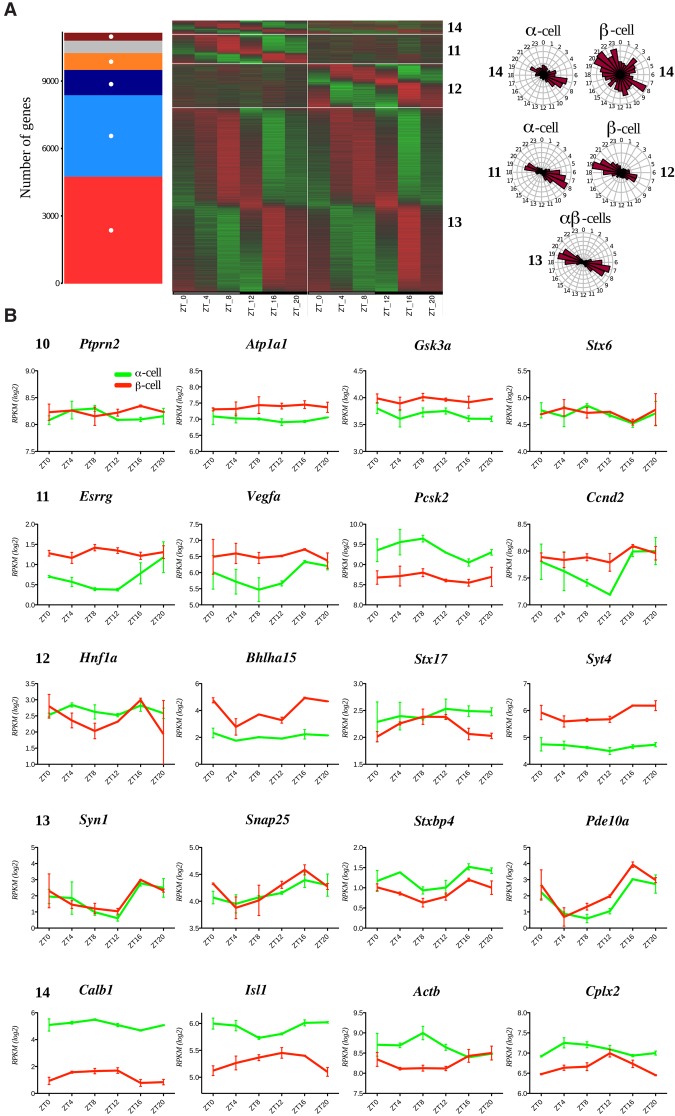
Figure 2.
Comparative analysis of temporal expression patterns of the transcripts expressed in α and β cells (group C in Fig. 1A). A total of 11,171 transcripts expressed in both α and β cells (log2 RPKM > 0) and exhibiting the expression level differences absolute log2 fold change <4 between the two cell types were assigned to one of the five models (models 10–14 in Fig. 1A). (A) The number of genes assigned in models and corresponding heat maps showing relative expression indicated in green (low) and red (high). The gray bar represents genes not classified in any models. Phase distribution of rhythmic genes is presented on the adjacent polar histograms for rhythmic genes in (1) one cell type (models 11 and 12), (2) both cell types with the same parameters (model 13), or (3) both cell types with different parameters (model 14). (B) Temporal profiles for selected transcripts expressed in both cell types delineated to one of the rhythmicity models. Data are expressed as mean ± SD of two independent experiments.

