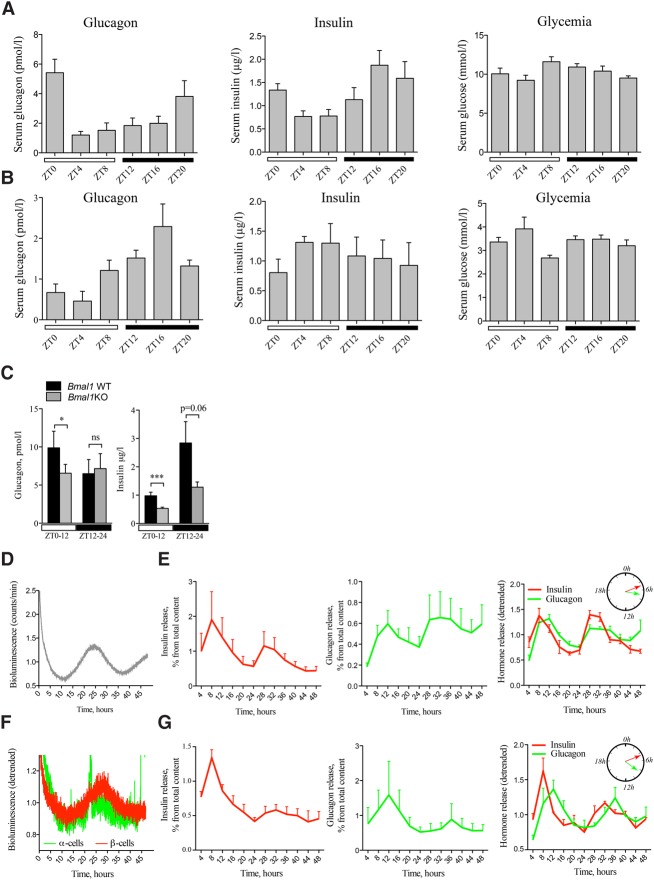
Figure 6.
Secretion of insulin and glucagon in vivo and in vitro exhibits rhythmic profiles altered in circadian mutant mice. In vivo insulin, glucagon, and glucose levels were assessed in the sera collected from night-fed animals (A) or animals fasted for 12 h prior to the experiment and during the entire period of serum collection (B). Obtained profiles were analyzed by CosinorJ and qualified as 24-h rhythmic for χ2 < 0.5 within the period length range of 18–30 h and nonrhythmic if χ2 ≥ 0.5 or outside this period length range. (A) Mouse sera were collected around the clock every 4 h (see Supplemental Fig. S1 for the design). n = 6–15 animals for each time point. Average serum insulin levels were χ2 = 0.0069 for period 22.05 h ± 2.2 h and phase 18.83 h ± 6.45 h (rhythmic), χ2 = 3.39 (nonrhythmic) for glucagon, and χ2 = 0.73 (nonrhythmic) for glucose. (B) Mouse sera were collected as described in A from n = 3–5 mice per time point. CosinorJ analysis results for average serum insulin levels were χ2 = 0.055 for period 20.1 h ± 6.04 h (rhythmic), χ2 = 0.21 for glucagon for period 24.0 h ± 1.59 h (rhythmic), and χ2 = 0.16 for glucose for period 10.5 h ± 2.17 h (nonrhythmic). (C) In vivo insulin and glucagon levels were assessed in mouse serum samples collected during the light phase (ZT0–ZT12; white square) and dark phase (ZT12–ZT24; black square) in night-fed Bmal1 knockout animals and their Bmal1 wild-type littermates. Light-phase insulin was assessed in n = 27 paired samples from Bmal1 knockout and Bmal1 wild-type mice (total of 54 animals). Dark phase insulin was assessed in 12 paired animal samples. Light-phase glucagon was measured in the blood samples from n = 16 pairs of animals (n = 12 pairs for the dark phase). Data are expressed as mean ± SEM. (***) P = 0.0006 for light-phase insulin; (*) P = 0.034 for light-phase glucagon, two-tailed paired t-test. (D,E) Circadian bioluminescence recording (D) with parallel assessment of hormone secretion (E) in perifused mixed islet cell populations after forskolin synchronization. n = 4 independent experiments with an average of four mice used per experiment. The perifusion medium contained 5.5 mM glucose and was collected every 4 h during 48 h. Hormone concentrations in the outflow medium were normalized to the total hormone content in the cell lysate at the end of each experiment and are expressed as the percentage of total content (mean ± SEM) (left and middle panels) or as superimposed detrended values (mean ± SEM) (right panel). CosinorJ analysis results for insulin levels were χ2 = 0.22 for period 19.49 h ± 1.17 h and phase 5.13 h ± 0.37 h (rhythmic) and χ2 = 0.064 for glucagon level for period 25.79 h ± 2.19 h and phase 7.05 h ± 0.75 h (rhythmic). (F,G) Circadian bioluminescence recording (F) with parallel assessment of insulin secretion in a separated β-cell population (G, left panel) and glucagon secretion in a separated α-cell population (G, middle panel). n = 3 independent experiments for α and for β cells, with and average of five mice used per experiment. α-Cell and β-cell populations were separated by FACS, plated, synchronized with forskolin pulse, and continuously perifused with culture medium containing 5.5 mM glucose for 48 h following synchronization. The outflow medium was collected every 4 h. Hormone concentrations in the outflow medium samples were normalized to the total hormone content in the cell lysate at the end of each experiment and are expressed as the percentage of total content (mean ± SEM) (left and middle panels) or as superimposed detrended values (mean ± SEM) (right panel). CosinorJ analysis results were χ2 = 0.19 for insulin level for period 23.17 h ± 0.56 h and phase 4.94 h ± 0.88 h (rhythmic) and χ2 = 0.04 for glucagon level for period 23.03 ± 1.14 h and phase 8.4 h ± 0.93 h (rhythmic).

