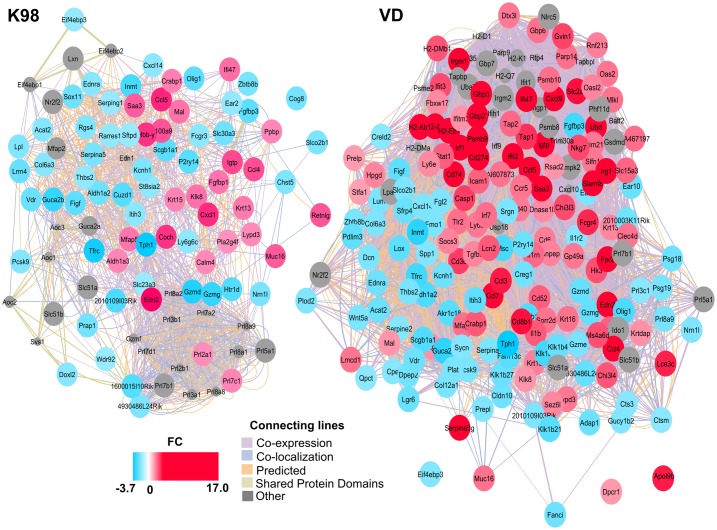
Fig 2. The interaction networks for DEGs between K98 and VD infected groups compared with the control groups predicted by GeneMania and visualized in Cytoscape.
Genes/proteins are depicted as colored circles and indicated by the color scheme, where shades in red correspond to FC > 1.5, shades in light blue correspond to FC < -1.5 and gray circles are other genes/proteins related to these DEGs, but not found in the microarray. Experimentally detected associations between genes/proteins are shown as connecting lines.

