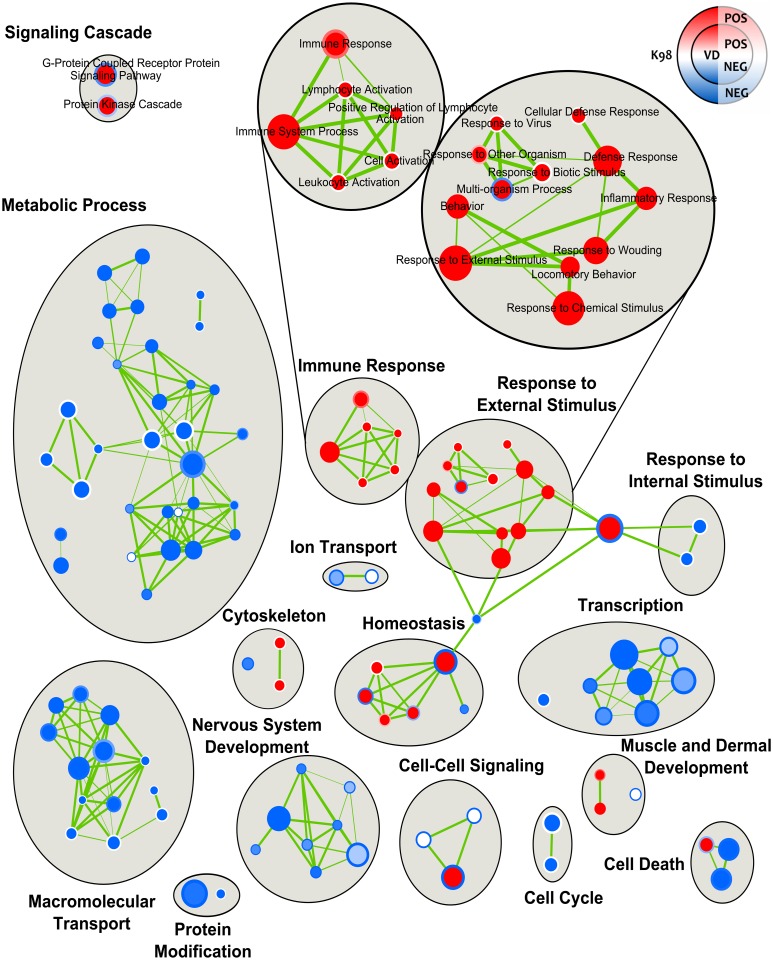
Fig 4. Enrichment map of the placental environment response to infection by T. cruzi.
The Enrichment Map arranges enriched gene-sets as a similarity network, where nodes correspond to gene-sets and links correspond to overlap of member genes. The network was manually rearranged to improve layout, and major clusters were manually labeled. Predicted pathways are depicted as circles, where shades in red correspond to up-regulated gene-sets and shades in light blue correspond to down-regulated gene-sets. The filling color corresponds to VD group and the border line color to K98 group.

