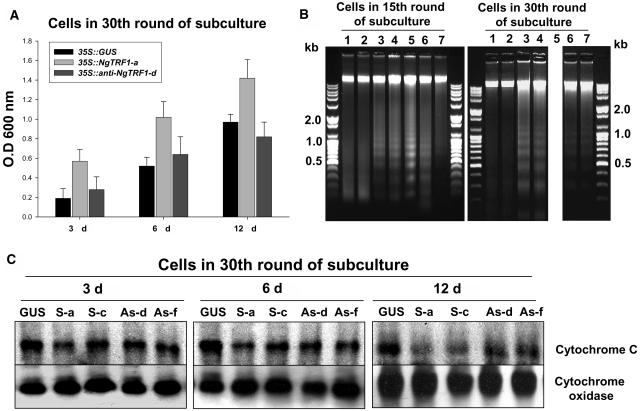
Figure 6.
Effect of Altered NgTRF1 Expression on Viability of Transgenic BY-2 Cells.
(A) Evaluation of cell death in 35::GUS, 35::NgTRF1-a, and 35S::anti-NgTRF1-d cells. Transgenic cells at the 30th round of batch subculture were stained with Evans blue as described in Methods. Cellular uptake of Evans blue was quantified by spectrophotometry. Data are expressed as the means ± sd of three experiments.
(B) Oligonucleosomal DNA fragmentation in 35::NgTRF1 and 35S::anti-NgTRF1 cells. Total genomic DNA was isolated from wild-type, 35::GUS, 35::NgTRF1, and 35S::anti-NgTRF1 cell lines at the 15th or 30th round of batch subculture. DNA was analyzed by 1.2% agarose gel electrophoresis with ethidium-bromide staining. Lane 1, wild type; lane 2, 35::GUS; lane 3, 35::NgTRF1-a; lane 4, 35::NgTRF1-c; lane 5, 35::NgTRF1-f; lane 6, 35S::anti-NgTRF1-d; lane 7, 35S::anti-NgTRF1-f. Positions of molecular weight–size markers are shown at the side of each panel. Note that a DNA sample from 35::NgTRF1-f cells at 30th round of batch subculture could not be obtained (lane 5) because these cells died after 25 rounds.
(C) Immunoblot analysis of cytochrome c release from mitochondria of transgenic BY-2 cells in the 30th round of batch subculture. Proteins were isolated from mitochondrial fractions, separated on 12.5% (w/v) SDS-PAGE, and analyzed by protein gel blotting with an antibody against cytochrome c. The level of cytochrome oxidase was also monitored as a protein loading control. GUS, 35S::GUS; S-a, 35S::NgTRF1-a; S-c, 35S::NgTRF1-c; As-d, 35S::anti-NgTRF1-d; As-f, 35S::anti-NgTRF1-f.

