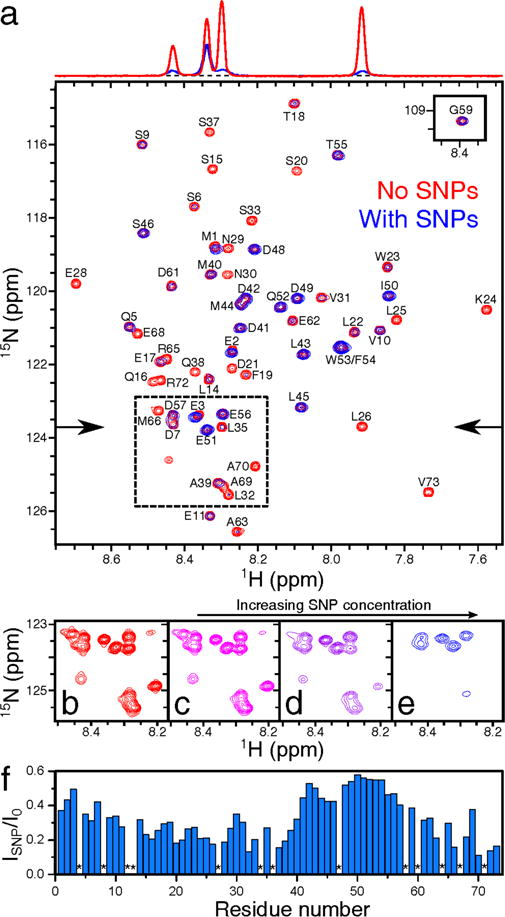
Figure 1.

Effect of interactions of WT p53TAD with silica nanoparticles on 1H-15H HSQC NMR spectrum. (a) Superimposed spectra of 200 μM protein samples in the absence (red) and presence (blue) of 4.7% [9.5 μM] SNPs by weight. The 1H cross-sections of the two HSQC spectra, indicated by the arrows, are displayed at the top, showing the effect of SNPs on the relative cross-peak intensities. (b) – (e) Representative spectral region (dashed box in (a)) showing a differential intensity decrease of some but not all cross-peaks with increasing SNP concentration from (b) 0.0% [0 μM], (c) 0.6% [1.2 μM], (d) 2.3% [4.7 μM], (e) 7.0% [14 μM] by weight in 250 μM protein samples. (f) Residue-intensity ratios are plotted as blue bars vs the primary sequence, except for prolines (*).
