Figure 2.

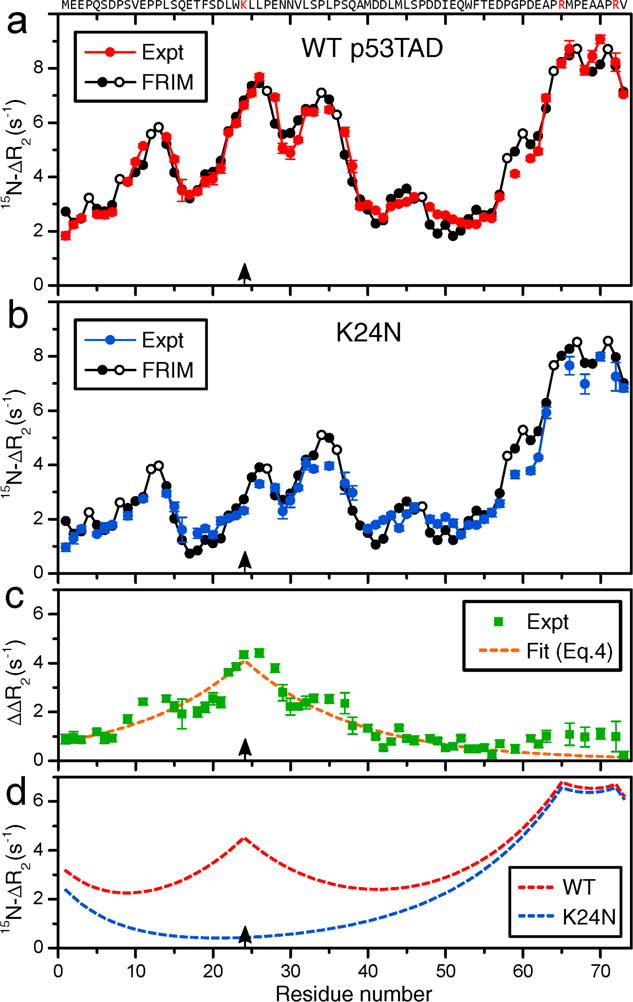
Residue-specific differences of NMR 15H backbone transverse relaxation rates of 300 μM (a) WT p53TAD (red solid circles) and (b) K24N mutant (blue solid circles) in the presence (2.5 μM) and absence of SNPs, i.e. , were plotted as a function of residue number. (a),(b) Predicted ΔR2 values by the free residue interaction model (FRIM) (Eq. (5)) are shown as black solid circles (except black open circles for Pro residues). (c) Difference of experimental ΔR2 profiles of (a) and (b) (green squares), ΔΔR2, depicting the effect of Lys24 (black arrows) on ΔR2. The dashed orange line is a fit using Eq. (4). (d) Cumulative effect of positively charged residues on global ΔR2 profiles using Eq. (4) for WT (red) and K24N mutant (blue).
