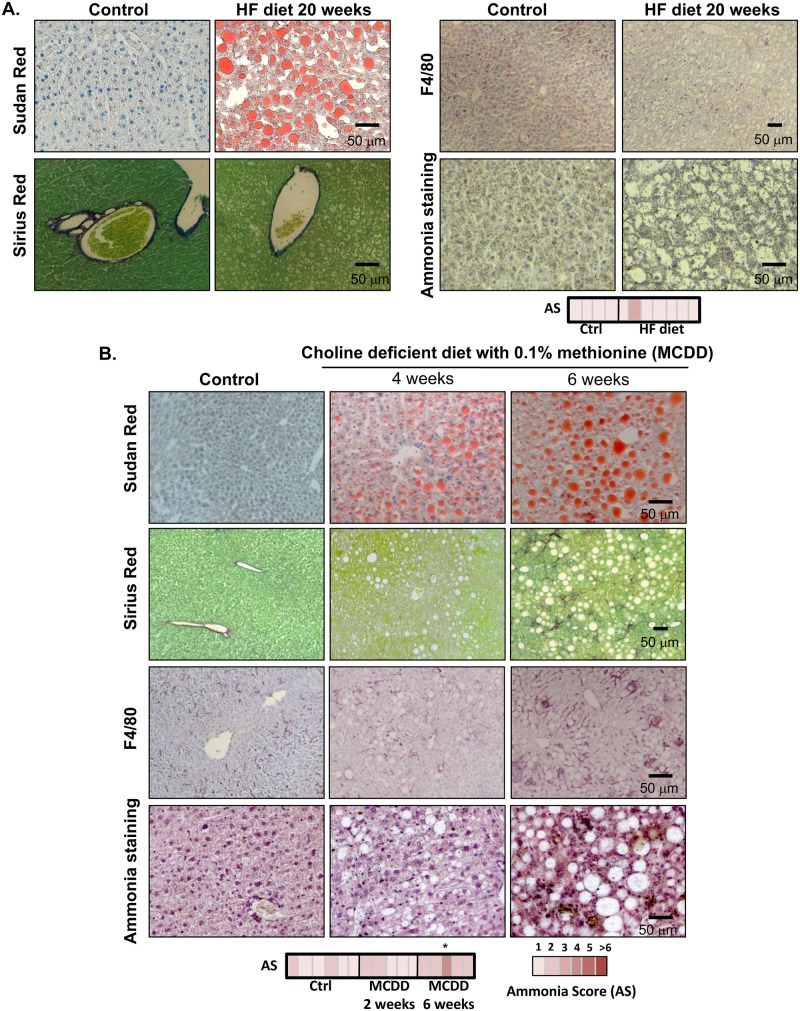
Fig 3. Hepatic ammonia staining in mouse models of Non-Alcoholic Fatty Liver Disease (NAFLD).
Representative micrographs of Sudan Red, Sirius Red, F4/80 and ammonia staining in liver samples from high-fat (HF) diet (n = 6 Ctrl vs. n = 7 HF diet), (A) and choline deficient with 0.1% methionine diet (MCDD)-fed rodents (n = 6 Ctrl vs. n = 5 MCDD 2 weeks and n = 5 MCDD 6 weeks) (B). AS was only significantly increased in MCDD 6 weeks vs. Ctrl, p<0.05.

