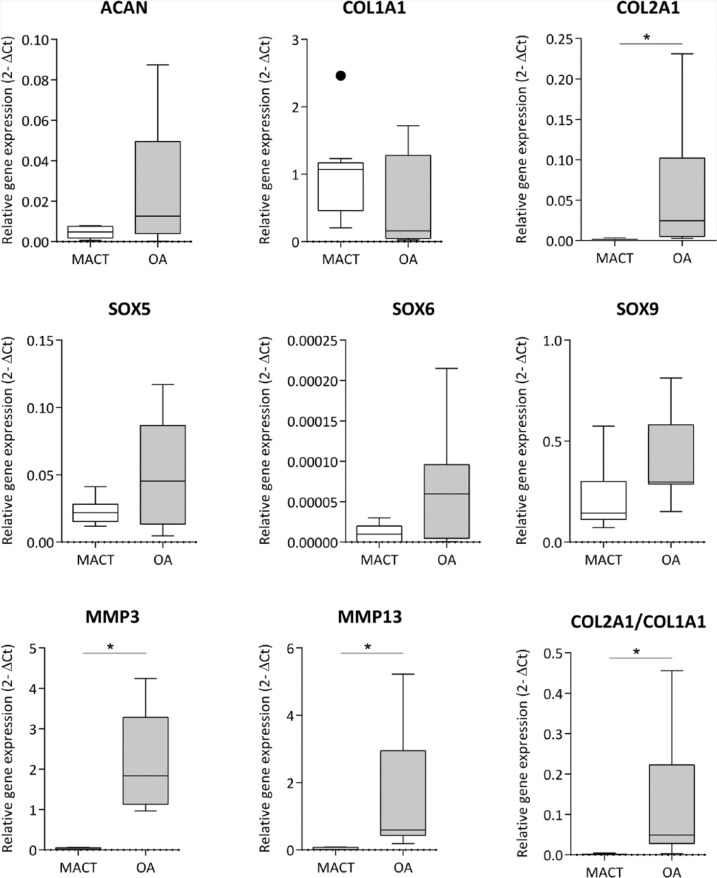
Figure 2.
RT-qPCR analysis of chondrogenic gene expression in both MACT (CaReS) and OA grafts. Gene expression levels of MACT and OA cells at the different ages were normalized to their respective GAPDH expression levels. MACT represents articular chondrocytes isolated from MACT grafts (CaReS) of age group subjects (41.9 ± 4.1) (n = 9) at day 14. OA represents osteoarthritic chondrocytes isolated from collagen type I hydrogels age group subjects (63.8 ± 10) (n = 9) at day 14. Data expressed as median and range with Tukey box and whisker plot: lower box = 75 percentile, upper box = 25 percentile, whisker = non-outlier range, dot = outlier, asterisk = extreme outlier (>1.5-fold above/below the box).

