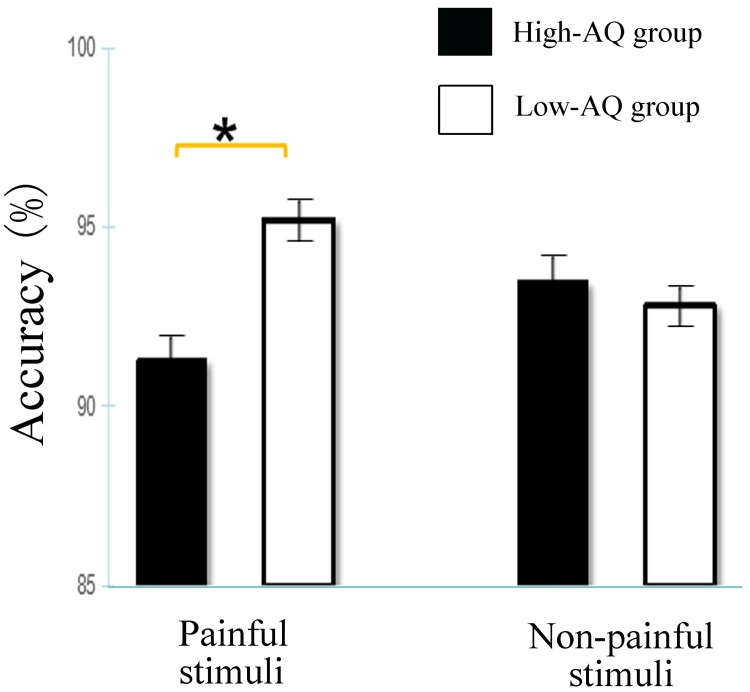
Fig 3. Bar graphs represent accuracy results of Stimulus Type × Autistic Traits interaction.
Data are presented as mean values (more details see S1 Table). Error bars represent standard error of the mean. For painful stimuli, the Low-AQ group was more accurate than the High-AQ group. In contrast, for non-painful stimuli, the Low-AQ group was not different from the High-AQ group. Significant effect at p< 0.05 is marked by an asterisk.

