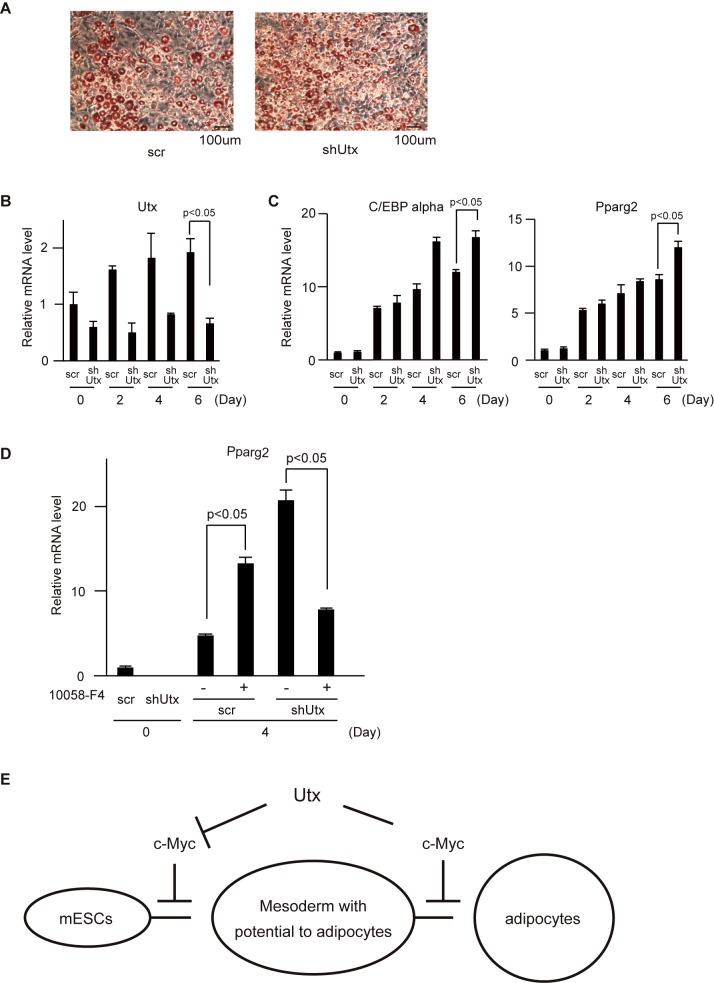
Fig 5. Knockdown of Utx in 3T3-L1 cells resulted in an enhancement of adipocyte differentiation.
(A) Oil-red O staining of adipocytes. Representative results from three independent experiments are shown. mRNA levels of (B) Utx, (C) C/EBP alpha, Pparg2, (D) Pparg2 normalized to β-actin. The experiments were performed independently three times in triplicates and the representative results are shown and expressed as mean ± SE. (n = 3) *p<0.05. (E) Schematic model of Utx during differentiation of mESCs to adipocytes.

