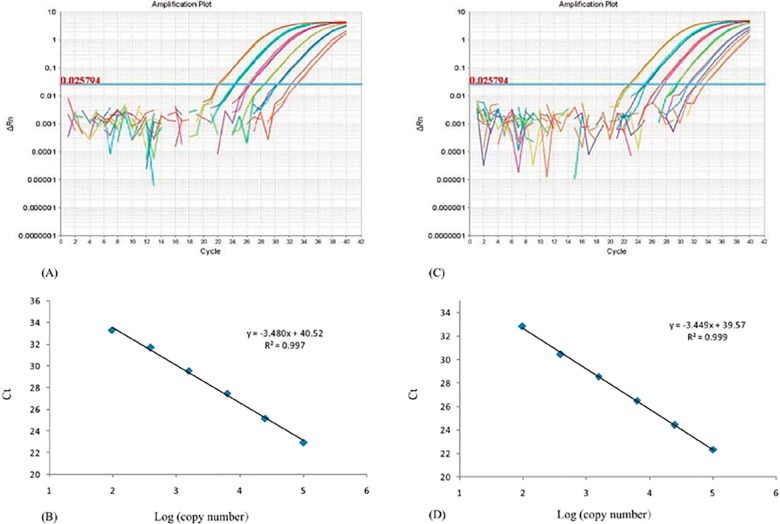
Fig 1. Amplification plots and standard curves for the RPA1 genes of chicken and sheep.
(A) Amplification plots of 4-fold dilution series of binary mixture DNA of chicken (from 1×10⁵ to 9.7×101 copies/μL). (B) Linearity test, regression line parameters of 4-fold dilution series of chicken DNA (from 1×10⁵ to 9.7×101 copies/μL) as standards. (C) Amplification plots of 4-fold dilution series of binary mixture DNA of sheep (from 1×10⁵ to 9.7×101 copies/μL). (D) Linearity test, regression line parameters of 4-fold dilution series of binary mixture DNA of sheep (from 1×10⁵ to 9.7×101 copies/μL) as standards. Each data point represents the mean of three replicates.

