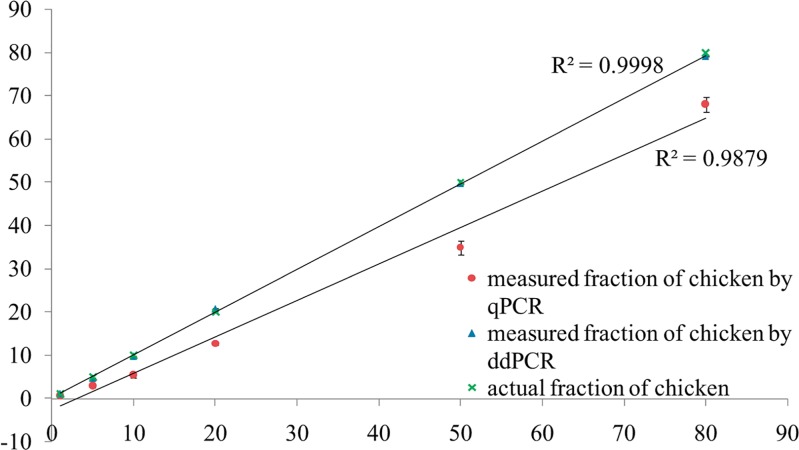
Fig 2. Dynamic range of the ddPCR assay for quantification of chicken and sheep fractions.
The vertical axis represents the measured fraction of chicken in sheep (w/w) by ddPCR and qPCR. The horizontal axis shows the actual fraction of chicken in sheep (w/w). Three replicates for each data point were analyzed. The points indicate the concentrations of 80%, 50%, 20%, 10%, 5% and 1% (w/w) of chicken in sheep. Linearity between the actual chicken fraction (w/w) and the measured chicken fraction (w/w) by ddPCR. The correlation coefficient (R2) for the weight of chicken was 0.9998 for ddPCR and 0.9878 for real-time PCR.

