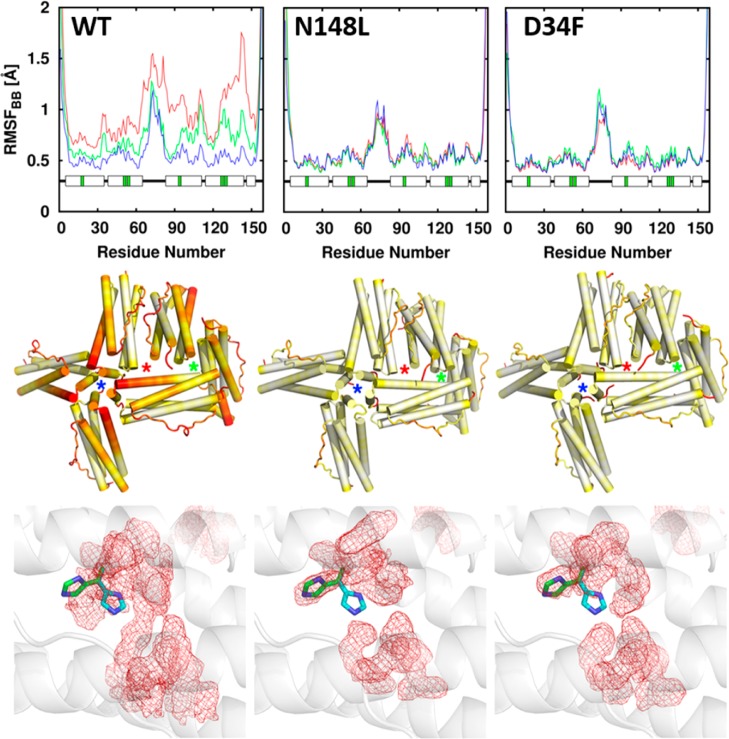
Figure 5.
(top) Per-residue backbone RMSF; blue, green, and red plots correspond to increasing ionic strength, respectively. (middle) RMSF mapped onto six subunits of a 24-mer assembly encompassing 4-fold (blue stars), 3-fold (green stars), and B-pores (red stars) shows that the flexibility near 4-fold and B-pores in wt BfrB is dampened in the mutants. In the color scale, flexibility increases from white to red. (bottom) The average conformation explored by FC residues during MD simulations is shown as red mesh; the gate open (green) and gate closed (cyan) conformations of H130 are shown in sticks.

