Figure 6.

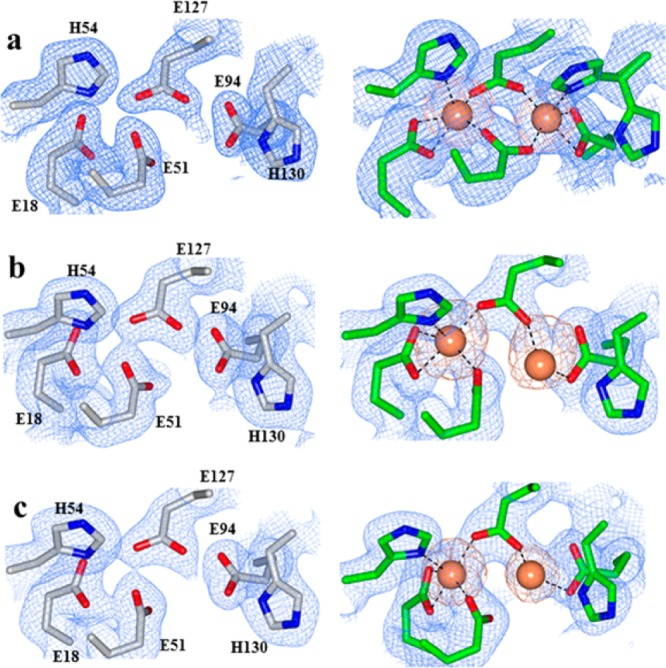
Electron density maps of FC ligands (blue mesh) and iron atoms (orange mesh) in (a) WT, (b) N148L, and (c) D34F BfrB. FCs from as isolated structures are on the left column and FCs from Fe-soaked structures on the right.

Electron density maps of FC ligands (blue mesh) and iron atoms (orange mesh) in (a) WT, (b) N148L, and (c) D34F BfrB. FCs from as isolated structures are on the left column and FCs from Fe-soaked structures on the right.