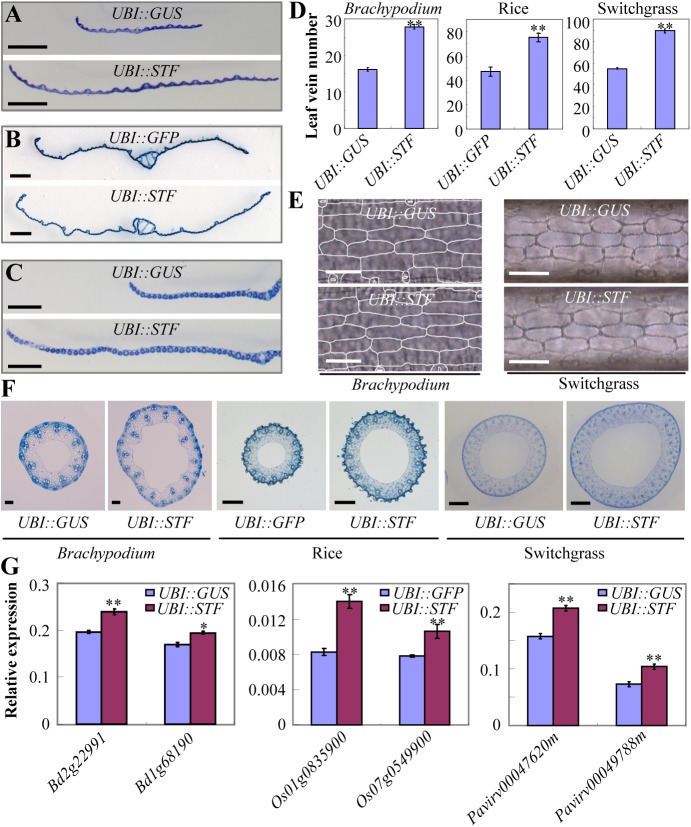
Fig 2. Ectopic expression of STF in grasses leads to significant increase in plant size primarily through promoting cell proliferation.
(A-C) Cross section of flag leaves of the control and STF overexpressing Brachypodium (A), rice (B) and switchgrass (C). Bars = 1 mm. (D) Comparison of leaf vein number of the control and STF transgenic Brachypodium, rice and switchgrass. Bars represent means ± SE (n = 7 plants). (E) Micrographs of cleared leaves of STF transgenic Brachypodium and switchgrass. Bars = 100 μm. (F) Cross section of internode Ⅱ (for rice and Brachpodium) and internode Ⅲ (for switchgrass) of STF transgenic Brachypodium, rice and switchgrass. Bars = 100 μm in Brachypodium, 1mm in rice and switchgrass. (G) Transcript level of Histone H4 in STF overexpressing Brachypodium, rice and switchgrass compared to controls. Bd, Brachypodium distachyon; Os, Oryza. Sativa; Pavirv, Panicum virgatum. Bars represent means ± SE of three technical replicates, two biological replicates. The asterisks indicate significant differences (* p<0.05, ** p < 0.01, Student t-test).

