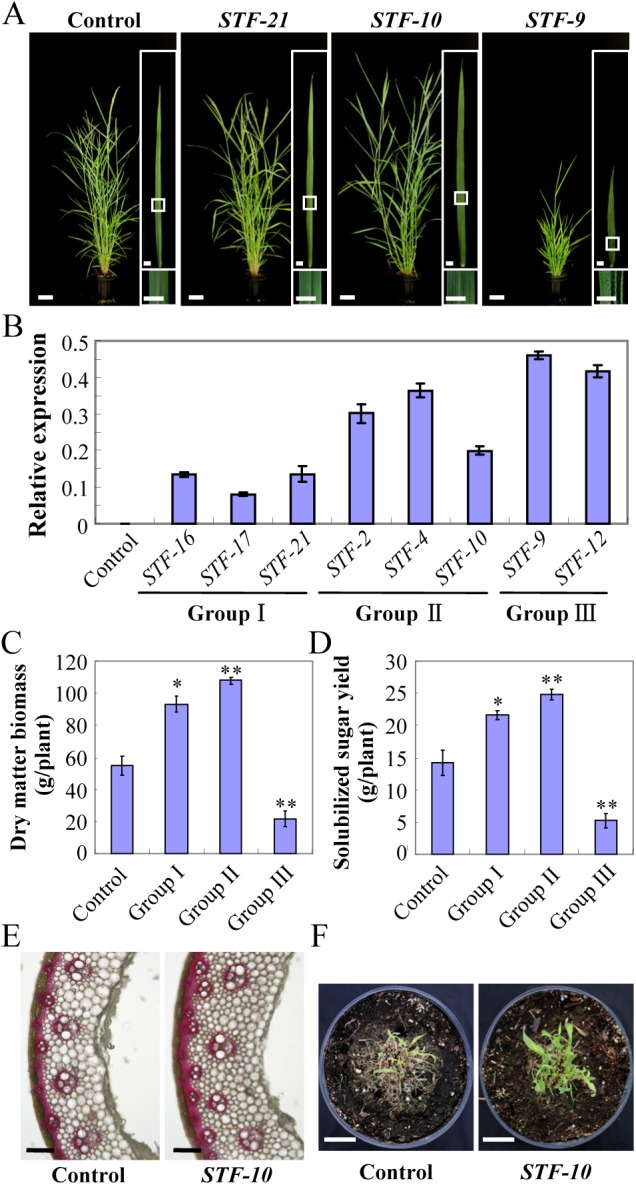
Fig 3. STF overexpression in switchgrass improves biomass yield and release of solubilized sugars.

(A) Morphology of switchgrass plants overexpressing different levels of STF at flowering. One representative from each group was shown. Bars = 10 cm for plants, 1cm for leaves. (B) Transcript abundance of STF in transgenic plants revealed by qRT-PCR. UBI::GUS-1 switchgrass plant was used as the control. Bars represent means ± SE of three technical replicates. (C) Comparison of postharvest dry weights of total above-ground biomass of three control (UBI::GUS plants) and three classes of STF overexpressors shown in (B) at maturity. Bars represent means ± SE (n = 3 independent plants for Control, Group Ⅰ, Ⅱ, and 2 plants for group Ⅲ), the asterisks indicate significant differences (*p<0.05, **p < 0.01, Student t-test). (D) Solubilized sugar yield of transgenic switchgrass plants compared to control (UBI::GUS plants) shown in (B). Bars represent means ± SE (n = 3 plants for Control, Group Ⅰ and Ⅱ, 2 plants for group Ⅲ), the asterisks indicate significant differences (*p<0.05, **p < 0.01, Student t-test). (E) Phloroglucinol-HCl staining of lignin in the internode Ⅲ of the control (UBI::GUS-1) and Group Ⅱ STF-10. Bars = 100 μm. (F) Recovery and growth establishment after shoot harvest. The STF transgenic switchgrass (Group Ⅱ STF-10) displays better recovery after cut back compared to the control (UBI::GUS-1). Plants shown were 2 weeks old after cutting. Bars = 5 cm.
