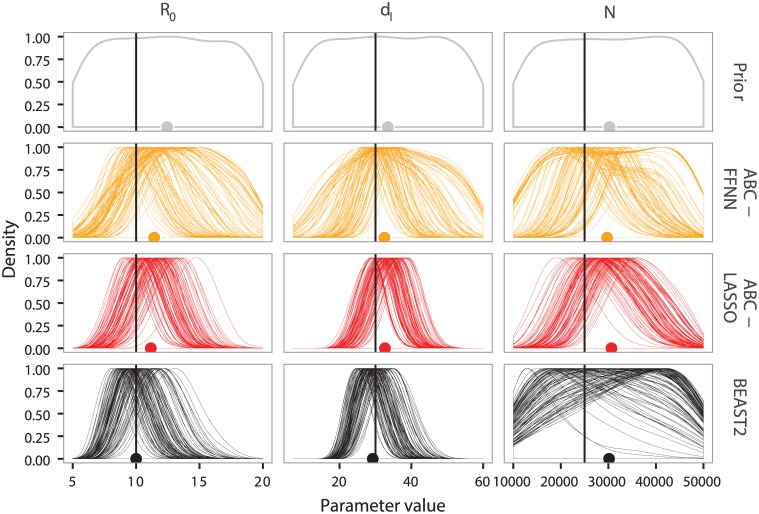
Fig 6. Prior and posterior distributions for parameter estimations by ABC-FFNN, ABC-LASSO and BEAST2-BDSIR.
Prior distributions are in gray, posterior distributions obtained by ABC-FFNN are in orange, those by ABC-LASSO are in red and those by BEAST2-BDSIR are in black. All summary statistics were used for both regression-ABC approaches. We displayed the results for one particular epidemiological scenario (R0 = 10, dI = 30 and p = 0.5) and for large trees. There are 100 replicates in this scenario. The dots represent the median of the posterior distribution merging for all replicates. The vertical black line represents the true value for each epidemiological parameter.

