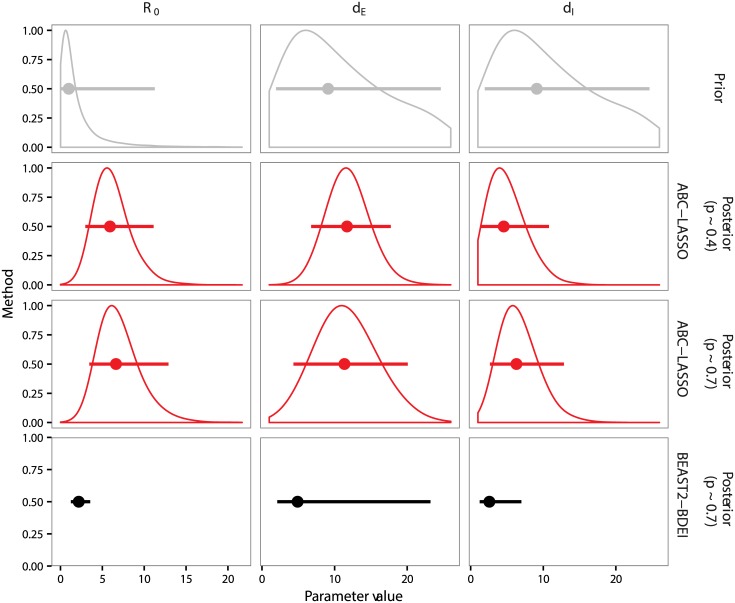
Fig 7. Prior and posterior distributions of parameter estimations from the Ebola phylogeny.
We show the results for two different inference methods: ABC-LASSO (in red) and BEAST2-BDEI (in black). Gray distributions correspond to the prior and red distributions correspond to ABC-LASSO posterior distributions. The dots represent the median and the vertical lines represent the 95% highest posterior density of each distribution. Statistics on the BEAST2-BDEI posterior distributions were obtained from [8].

