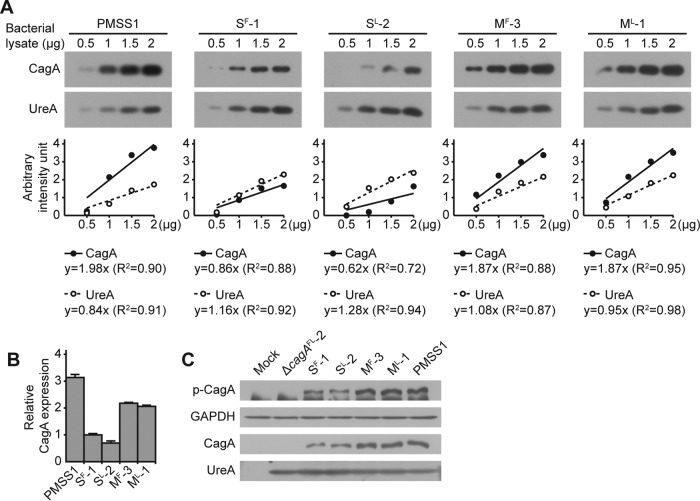
FIG 3 .
Relative levels of CagA protein and CagA phosphorylation. (A) The protein levels of CagA and UreA in lysates of H. pylori strains PMSS1, SF-1, SL-2, MF-3, and ML-1 were measured by Western blotting (upper panel). For each lysate, 0.5, 1, 1.5, and 2 μg of total protein were used to determine standard curves for CagA and UreA. The immunoblot images were analyzed using ImageJ software, and the values were plotted on a graph (lower panel). (B) Ratios of CagA to UreA were calculated, and each value was normalized to the value calculated for cagA-SF-1 to determine relative CagA protein levels. The bar graphs indicate average levels of CagA expression of each strain, and error bars represent standard deviations, derived from results of 2 independent experiments. (C) Lysates of AGS cells that were infected with H. pylori strains PMSS1, ΔcagAFL-2, SF-1, SL-2, MF-3, and ML-1 were immunoblotted for phosphorylated CagA (p-CagA), glyceraldehyde-3-phosphate dehydrogenase (GAPDH), CagA, and UreA. GAPDH and UreA were used as controls.

