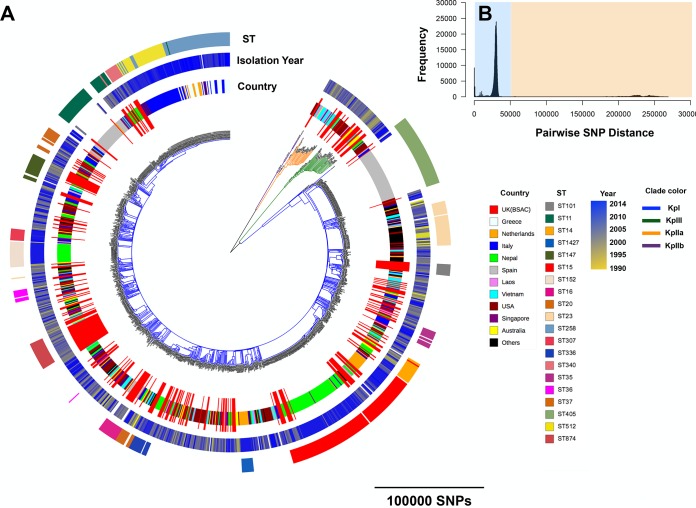
FIG 1 .
(A) A neighbor-joining tree based on 1,000,726 SNPs and constructed for the combined United Kingdom and global collections with their STs and years of isolation. Only STs that were represented by at least 10 isolates in the population are shown. The United Kingdom (BSAC) isolates are the United Kingdom and Ireland MDR isolates. (B) The distribution of pairwise SNP differences in the United Kingdom samples and the global collection. The blue and yellow backgrounds correspond to the different levels of divergence discussed in the text.

