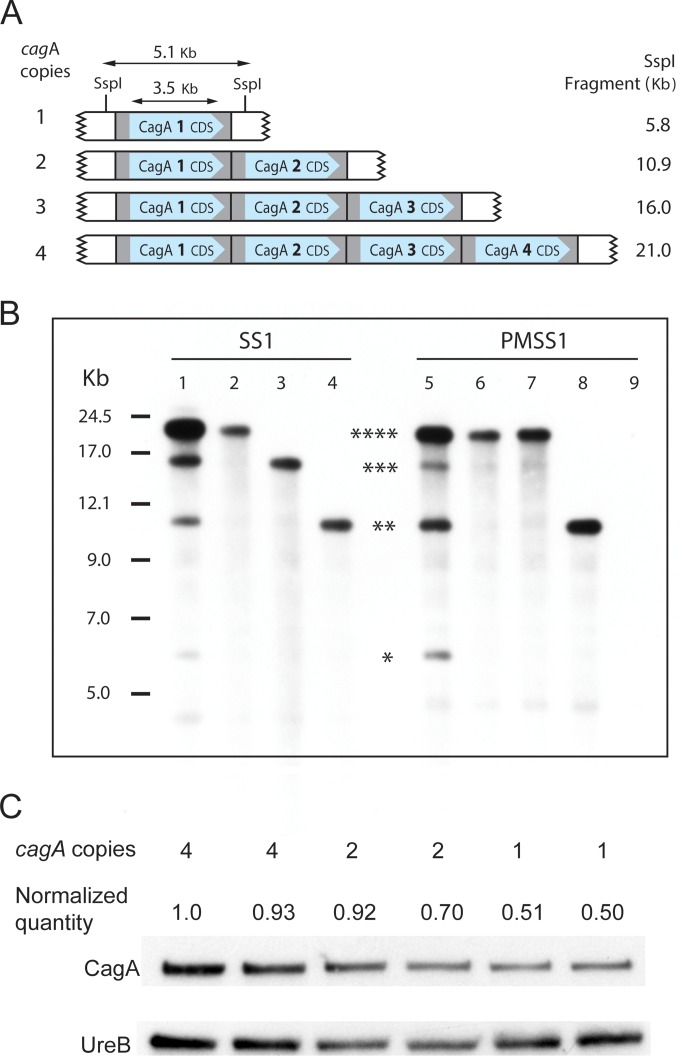
FIG 4 .
H. pylori SS1 and PMSS1 are gene copy number variable at the cagA locus. (A) Schematic diagram showing tandem arrays of the identical 5,072-bp repeat regions at the cagA locus, all of which contain identical copies of the 3,540-bp cagA gene. The SspI fragment sizes of strains with 1 to 4 cagA copies are shown at the right. The drawing is not to scale. (B) Southern blot of SspI-digested genomic DNA from H. pylori SS1 or PMSS1 probed with a 297-bp PCR product amplified from SS1 cagA bp 1217 to 1514. The original working stocks of SS1 (lane 1) and PMSS1 (lane 5) showed bands corresponding in size to 4, 3, 2, and 1 copies of cagA (asterisks). Subculture of 4 single colonies from the freezer stocks demonstrated clones with 4, 3, or 2 copies of cagA (lanes 2 to 4) from SS1; subculture of 12 single colonies showed either 4 or 2 copies of cagA in PMSS1 (lanes 6 to 8). PMSS1 with a cagA deletion served as a negative control (lane 9). A kilobase ladder is shown at the left. (C) Western blot of H. pylori PMSS1 to examine whether the cagA copy number is positively correlated with protein expression. For this analysis, six individual single-colony isolates of PMSS1 were used, two each with four copies, two copies, or one copy of cagA. Relative quantities of protein in each band were determined using Image Lab software (Bio-Rad Laboratories). The density of the CagA band was divided by the density of the corresponding UreB band to obtain the normalized quantity of CagA to account for differences in gel loading.

