
Extended Data Figure 10. High probability schizophrenia risk loci predicted by Hi-C interactions and cortical eQTL.
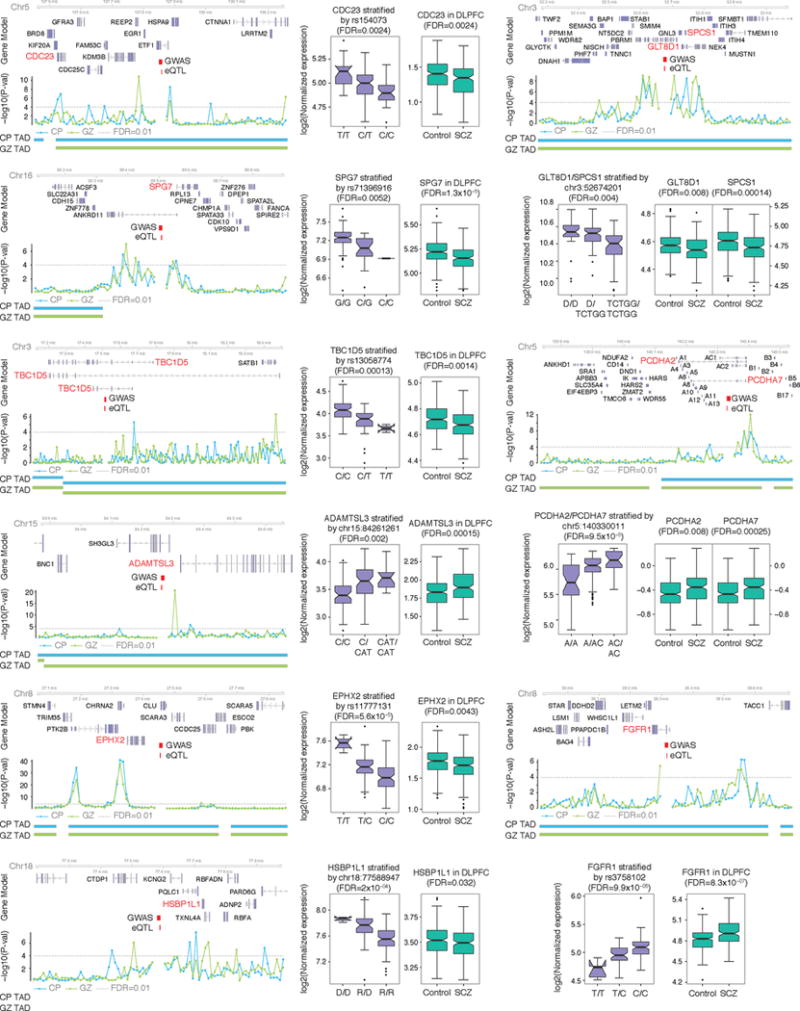
Hi-C interactions and eQTL association target the same gene (marked in red). Risk alleles lead to target gene dysregulation in the same direction as in schizophrenia brains. Chromosome ideogram and genomic axis (top); gene model based on Gencode v.19 and target genes identified by both Hi-C and eQTL are marked in red; Genomic coordinates for the 10 kb bin containing credible SNPs (schizophrenia GWAS) and eQTL; –log10[P value], P value for the significance of the interaction between schizophrenia credible SNPs and each 10 kb bin, grey dashed line denotes FDR = 0.01; TAD borders in CP and GZ are indicated. Protocadherins (PCDH) gene family is marked as A (PCDHA) and B (PCDHB) except target genes, PCDHA2 and PCDHA7. Whiskers and centre lines correspond to 1.5 × IQR and median, respectively.